Kursformationer
Kursgrafen viser, hvordan optimismen hos investorerne har svinget over tid. Ved at se, hvilke opture og nedture de har været gennem, kan vi sige noget om, hvad de tænker og føler. På den måde kan vi også sige noget om, hvad de vil gøre fremover.
Visse mønstre, kaldet kursformationer, kan forklares med præcise beskrivelser af investorernes psykologiske tilstande. Når disse dannes i kursgrafer gives klare købs- eller salgssignaler. Identifikation og handel på kursformationer er meget centralt i teknisk analyse.
Investtech har lavet computerprogrammer, som identificerer formationer og tegner dem ind i graferne. Købssignaler angives med grønne pile og salgssignaler med røde pile. Højden på pilene angiver forventet kursbevægelse.
Hovedprincipper
- Køb aktier som har givet købssignal fra kursformation.
- Sælg aktier som har givet salgssignal fra kursformation.
Topformationer
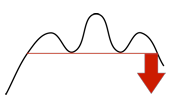
Hoved-og-skuldre-formation
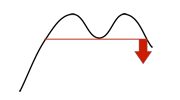
Dobbel-top-formation
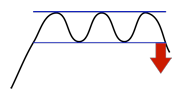
Rektangelformation
- Varsler at en stigende trend er ovre, og at en faldende trend starter.
- Sælg!
Bundformationer
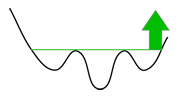
Omvendt-hoved-og-skuldre-formation
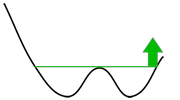
Dobbel-bund-formation
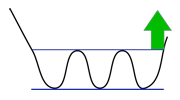
Rektangelformation
- Varsler at en faldende trend er ovre, og at en stigende trend starter.
- Køb!
Fortsættende formationer
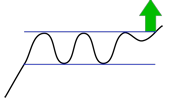
Rektangelformation køb
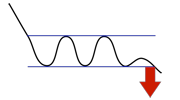
Rektangelformation sælg
- Varsler at en konsolideringssituation er ovre.
- Kan give købssignal om, at en stigende trend fortsætter op.
- Kan give salgssignal om, at en faldende trend fortsætter ned.
Vigtige detaljer
- Kraften bag en kursbevægelse beskrives med volumenet. En øgning i volumenet forstærker et signal fra en formation. En reduktion i volumenet er ofte tegn på et falskt signal.
- Ofte kan kursen gå meget direkte efter et brud. Derfor bør man handle hurtigt ved et brud. Imidlertid kan kursen mange gange bevæge sig tilbage igen lidt senere, så var man for sen på den i første omgang, kan man ofte få en ny mulighed.
- Selv om kursen når kursmålet (højden på pilen), kan aktien ofte gå meget længere. Kursformationer varsler indledning eller fortsættelse af trender. Trender er den kraftigste indikator, vi har. Så længe trenden er intakt, bør positionen sædvanligvis holdes.
Buy signal from rectangle formation
A buy signal from a rectangle formation signals increasing optimism among investors and signals that the stock continues or enters a rising trend.
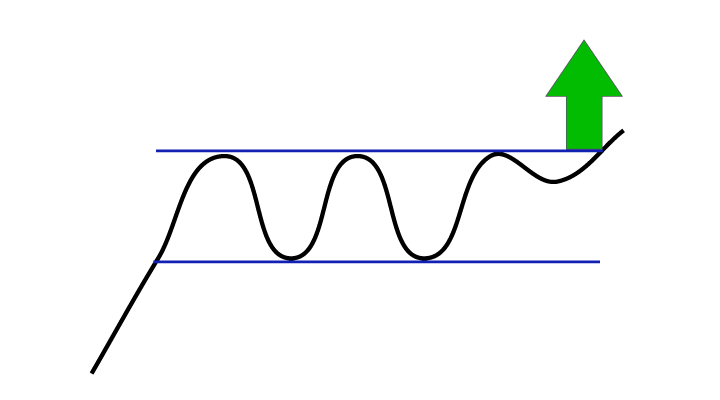
A stock that has triggered a buy signal from a rectangle formation is indicated to rise further. This is especially the case when the stock price is already in a rising trend channel. Investors have experienced a positive surprise which has triggered the signal, and optimism is on the increase.
Details
Volume is a good indicator of the strength of the buy signal. High volume on rising prices indicates that aggressive buyers keep paying more in order to buy. This is positive for further development. High volume and positive volume balance will strengthen a buy signal.
Rectangle formations are usually continuing formations. This means that the price usually continues in the long term direction, or the long term trend, it was in before the formation. Rectangle formations that trigger buy signals in rising trends are therefore seen to give stronger signals than rectangle formations that trigger buy signals in falling trends.
Small rectangle formations can trigger false buy signals. This is especially the case when the formation is small, when the stock remains in a falling trend channel, and when volume development is negative. At buy signal from a rectangle formation the stock as a whole should be assessed, not solely the buy signal. Many investors have bought long term losers too soon following weak buy signals from rectangle formations. The following applies:
- Long rectangle formations are stronger than short ones.
- Buy signals with positive volume development are stronger than buy signals with negative volume development.
- Buy signals when the chart shows a rising trend are stronger than when the chart shows a falling trend.
- Buy signals with a break upward though a falling trend, including break above the previous pivot top, are stronger than if trend and pivot top are not broken.
Investtech-Research: Buy signal from rectangle formation
Aktien mit solchen kaufsignale haben sich in den Monaten danach im Durchschnitt besser als der Markt entwickelt. Die annualisierte Mehrrendite war 9.0 Prozentpunkte (%p). Das ist signfikant besser als der Referenzindex.
| Annualisierte Rendite (basierend auf 66 Tagen) | |
| Kaufsignale mittlere sicht | 19.8% |
| Referenzindex | 10.8% |
| Mehrrendite | 9.0%p |
Diese Analyseergebnisse basieren auf 3368 Signalen für nordische Aktien im Zeitraum 2008-2020.
Mehr dazu hier
- Researchbericht: Investtech Research: Return following signals from rectangle formations in stock prices - medium term, Nordic markets, 1996-2018 (Erforderliche Benutzerebene: PRO)
- Researchartikel: Sterk meravkastning etter kjøpssignaler fra rektangelformasjoner
- Researchbericht: Investtech-forskning: Signalstatistikk kursformasjoner under koronapandemien, Norden 2019-2020. (Erforderliche Benutzerebene: PRO)
- Researchartikel: Investtech-forskning: Formasjoner gav ikke signifikante signaler under koronapandemien
- Researchbericht: Investtech-forskning: Kursformasjoner - signalstatistikk Norden 2008-2020 (Erforderliche Benutzerebene: PRO)
Sell signal from rectangle formation
A sell signal from a rectangle formation signals increasing pessimism among investors and signals that the stock continues or enters a falling trend.
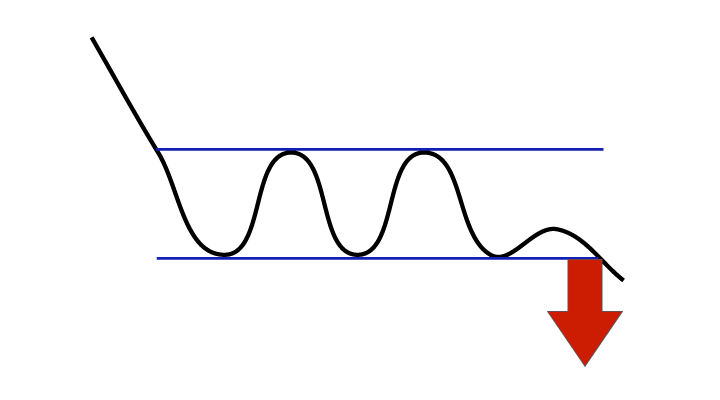
A stock that has triggered a sell signal from a rectangle formation is indicated to fall further. This is especially the case when the stock price is already in a falling trend channel. Investors have experienced a negative surprise which has triggered the signal, and the level of fear is increasing.
Details
Volume is a good indicator of the strength of the sell signal. High volume on falling prices indicates that aggressive sellers keep reducing the price in order to sell. This is negative for further development. High volume and negative volume balance will strengthen a sell signal.
Rectangle formations are usually continuing formations. This means that the price usually continues in the long term direction, or the long term trend, it was in before the formation. Rectangle formations that trigger sell signals in falling trends are therefore seen to give stronger signals than rectangle formations that trigger sell signals in rising trends.
Small rectangle formations can trigger false sell signals. This is especially the case when the formation is small, when the stock remains in a rising trend channel, and when volume development is positive. At sell signal from a rectangle formation the stock as a whole should be assessed, not solely the sell signal. Many investors have sold long term winners too soon following weak sell signals from rectangle formations. The following applies:
- Long rectangle formations are stronger than short ones.
- Sell signals with negative volume development are stronger than sell signals with positive volume development.
- Sell signals when the chart shows a falling trend are stronger than when the chart shows a rising trend.
- Sell signals with a break downward from a rising trend, including break below the previous pivot bottom, are stronger than if trend and pivot bottom are not broken.
Investtech-Research: Sell signal from rectangle formation
Aktien mit solchen verkaufssignale haben sich in den Monaten danach im Durchschnitt schwächer als der Markt entwickelt. Die annualisierte Minderrendite war 6.6 Prozentpunkte (%p). Das ist signifikant schwächer als der Referenzindex.
| Annualisierte Rendite (basierend auf 66 Tagen) | |
| Verkaufssignale mittlere sicht | 4.3% |
| Referenzindex | 10.9% |
| Mehrrendite | -6.6%p |
Diese Analyseergebnisse basieren auf 2677 Signalen für nordische Aktien im Zeitraum 2008-2020.
Mehr dazu hier
- Researchbericht: Investtech Research: Return following signals from rectangle formations in stock prices - medium term, Nordic markets, 1996-2018 (Erforderliche Benutzerebene: PRO)
- Researchartikel: Gode salgssignaler fra rektangelformasjoner
- Researchbericht: Investtech-forskning: Signalstatistikk kursformasjoner under koronapandemien, Norden 2019-2020. (Erforderliche Benutzerebene: PRO)
- Researchartikel: Investtech-forskning: Formasjoner gav ikke signifikante signaler under koronapandemien
- Researchbericht: Investtech-forskning: Kursformasjoner - signalstatistikk Norden 2008-2020 (Erforderliche Benutzerebene: PRO)
Rektangelformation under udvikling
En rektangelformation markerer en konsolidering i markedet. Jo længere formationen udvikler sig, jo højere pres bygges der op blandt investorerne. Når formationen brydes, følges det gerne af en kraftig kursbevægelse i samme retning.
Købssignal fra sådanne formationer har givet statistisk gode signaler ifølge Investtechs forskningsrapporter for flere børser.

Følg med når rektangelformationer udvikles. Især hvis kursen samtidig ligger i en stigende trend, og volumenudviklingen er positiv, gives kraftige købssignaler. Brud ned giver kraftige salgssignaler, især når kursen samtidig ligger i en faldende trend, og volumenudviklingen er negativ.
Inverse head and shoulders formation
A buy signal from an inverse head and shoulders formation signals increasing optimism among investors and the beginning of a rising trend. Formations like this are considered some of the most reliable formations in technical analysis.
An inverse head and shoulders formation is a bottom formation which marks the end of a falling trend. The formation consists of a left shoulder, a head and a right shoulder, connected by a neckline. The buy signal is triggered when the price breaks upwards through the neckline heading up from the right shoulder.
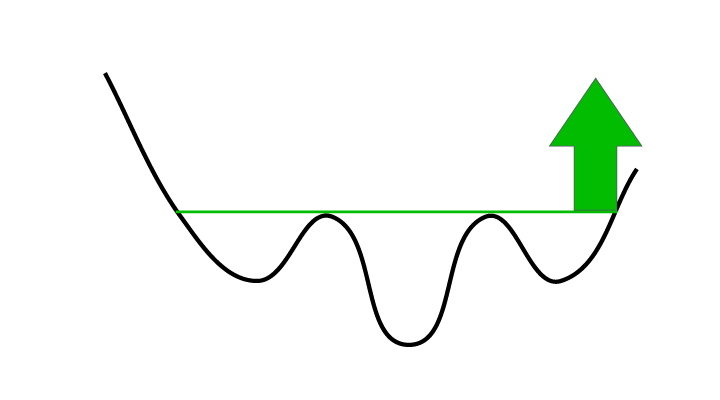
On the left shoulder investors are negative. The trend is falling and it does not look good for the company. As the pessimism wanes, the head is formed. Here the stock might break out from a falling trend channel and buyers become more aggressive or sellers more passive. On the right shoulder, the pessimists are unable to push the price downwards to a new bottom. Instead buyers push the price upwards through the neckline and the buy signal is triggered. The stock breaks upwards through resistance at the neckline and a rising trend begins.
A stock that has triggered a buy signal from an inverse head and shoulders formation is indicated to continue rising, for at least as long as the formation is high.
Please note that false buy signals from small inverse head and shoulders formations may arise in long term falling trends. Sometimes these can be spotted by a reduction in volume on the break. This indicates little strength in the price movement, and the stock can easily break down again and continue the falling trend. In such situations it can be advantageous to keep the stock and wait to see what happens also after the buy signal. This is especially the case if the stock is still in a falling trend or faces resistance from previous tops.
Sometimes good indicators of a coming break exist before the neckline is broken. Volume reduction on or towards the bottom of the right shoulder indicates that the sellers are passive. Increasing volume on the way up from the head or up from the right shoulder indicates that buyers are aggressive. Aggressive buyers and passive sellers are a good mix and a clear indication of increasing optimism in the stock and a coming break upward. In such situations it can be advantageous to buy before the buy signal is triggered.
Investtech-Research: Inverse head and shoulders formation
Aktien mit solchen kaufsignale haben sich in den Monaten danach im Durchschnitt besser als der Markt entwickelt. Die annualisierte Mehrrendite war 4.3 Prozentpunkte (%p). Das ist signfikant besser als der Referenzindex.
| Annualisierte Rendite (basierend auf 66 Tagen) | |
| Kaufsignale mittlere sicht | 14.0% |
| Referenzindex | 9.7% |
| Mehrrendite | 4.3%p |
Diese Analyseergebnisse basieren auf 1212 Signalen für nordische Aktien im Zeitraum 2008-2020.
Mehr dazu hier
- Researchbericht: Investtech Research: Return following signals from inverse/head and shoulders formations in stock prices - medium term, Nordic markets 1996-2018
- Researchartikel: Meravkastning etter kjøpssignaler fra omvendt-hode-og-skuldre-formasjoner
- Researchbericht: Investtech-forskning: Kursformasjoner - signalstatistikk Norden 2008-2020 (Erforderliche Benutzerebene: PRO)
- Researchartikel: Investtech-forskning: Kursformasjoner 2008 - 2020
Omvendt-hoved-og-skuldre-formation under udvikling
En mulig omvendt-hoved-og-skuldre-formation er under udvikling. Den vil kunne udløse et kraftigt købssignal.
Signaler fra sådanne formationer anses som nogle af de kraftigste købssignaler inden for teknisk analyse. Vær opmærksom på, at et signal snart vil kunne udløses. I nogle situationer kan det være gunstigt, at købe før købssignalet udløses, da dette giver en klart større upside.
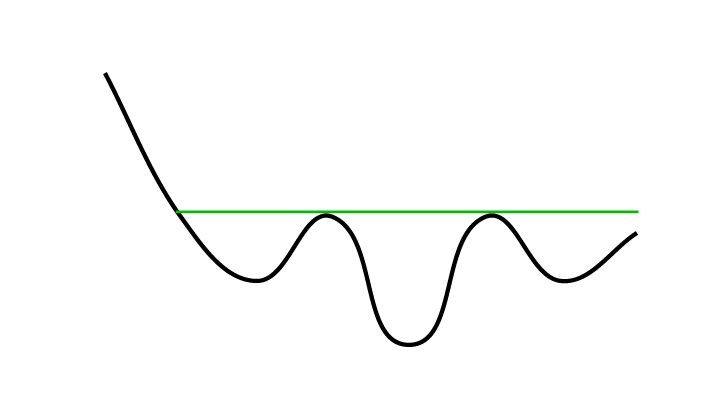
Vigtige indikatorer på et kommende brud op er:
- Positiv volumenbalance
- Brud på faldende trend
- Øgende volumen på vej op fra hovedet
- Aftagende volumen på vej ned mod højre skulder
- Øgende volumen på vej op fra højre skulder
Hvis volumenudviklingen derimod er negativ, og aktien fortsat ligger i en faldende trend, indikeres frygt hos investorerne og en videre negativ udvikling for aktien.
Head and shoulders formation
A sell signal from a head and shoulders formation signals increasing pessimism among investors and the start of a falling trend. Formations like this are considered some of the most reliable formations in technical analysis.
A head and shoulders formation is a top formation which marks the end of a rising period. The formation consists of a left shoulder, a head and a right shoulder, connected by a neckline. The sell signal is triggered when the price breaks downwards through the neckline heading down from the right shoulder.
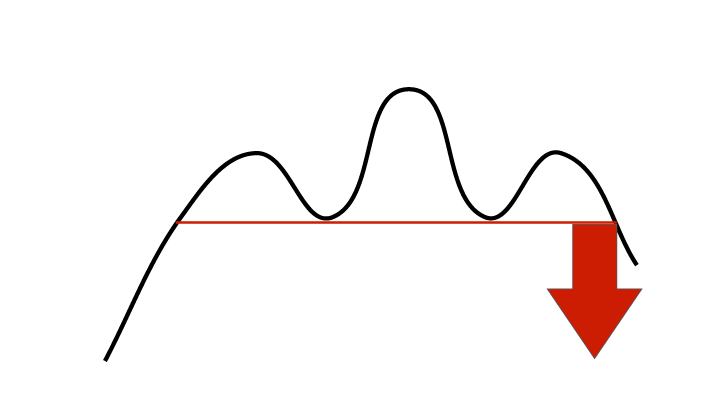
At the left shoulder, investors are optimistic. The trend is rising and things are looking good for the company. Optimism is reduced when the head is formed. Here the stock might break out from the trend channel and buyers become more passive or sellers more aggressive. At the right shoulder, the optimists are unable to push the price upwards to a new top. Instead sellers push the price downwards through the neckline and a sell signal is triggered.
The stock breaks support at the neckline and a falling trend begins. A stock that has triggered a sell signal from a head and shoulders formation is indicated to continue falling, for at least as long as the formation is high.
Please note that false sell signals from small head and shoulders formations may arise in long term rising trends. Sometimes these can be spotted by a reduction in volume on the break. This indicates little strength in the price movement, and the stock can easily break upwards again and continue the rising trend. In such situations it can be advantageous to keep the stock and wait to see what happens also after the sell signal. This is especially the case if the stock is still in a rising trend or has support from previous bottoms.
Sometimes good indicators of a coming break exist before the neckline is broken. Volume reduction on or towards the top of the right shoulder indicates that the buyers are passive. Increasing volume on the way down from the head or down from the right shoulder indicates that sellers are aggressive. Passive buyers and aggressive sellers are a bad mix and a clear indication of increasing pessimism in the stock and a coming break downward. In such situations it can be advantageous to sell before the sell signal is triggered.
Investtech-Research: Head and shoulders formation
Aktien mit solchen verkaufssignale haben sich in den Monaten danach im Durchschnitt schwächer als der Markt entwickelt. Die annualisierte Rendite lag 1.0 Prozentpunkte (%p) unter dem Referenzindex.
| Annualisierte Rendite (basierend auf 66 Tagen) | |
| Verkaufssignale mittlere sicht | 8.3% |
| Referenzindex | 9.3% |
| Mehrrendite | -1.0%p |
Diese Analyseergebnisse basieren auf 1444 Signalen für nordische Aktien im Zeitraum 2008-2020.
Mehr dazu hier
- Researchbericht: Investtech Research: Return following signals from inverse/head and shoulders formations in stock prices - medium term, Nordic markets 1996-2018
- Researchartikel: Salgssignaler fra hode-og-skuldre-formasjoner har varierende prediksjonskraft
- Researchbericht: Investtech-forskning: Kursformasjoner - signalstatistikk Norden 2008-2020 (Erforderliche Benutzerebene: PRO)
- Researchartikel: Investtech-forskning: Kursformasjoner 2008 - 2020
Hoved-og-skuldre-formation under udvikling
En mulig hoved-og-skuldre-formation er under udvikling. Den vil kunne udløse et kraftigt salgssignal.
Signaler fra sådanne formationer anses som nogle af de kraftigste salgssignaler inden for teknisk analyse. Vær opmærksom på, at et signal snart vil kunne udløses. I nogle situationer kan det være gunstigt, at sælge før salgssignalet udløses for at undgå risikoen for et større tab.

Vigtige faretegn er:
- Negativ volumenbalance
- Brud på stigende trend
- Øgende volumen på vej ned fra hovedet
- Aftagende volumen på vej op mod højre skulder
- Øgende volumen på vej ned fra højre skulder
Hvis volumenudviklingen derimod er positiv, og aktien fortsat ligger i en stigende trend, indikeres optimisme hos investorerne og en videre positiv udvikling for aktien.
Buy signal from double bottom formation
A buy signal from a double bottom formation signals increasing optimism among investors and the beginning of a rising trend.
A double bottom formation is a bottom formation which marks the end of a falling period. The formation consists of two bottoms of about the same depth. The buy signal is triggered when the price breaks upwards above the bottoms.

At the first bottom the investors are pessimistic. There is a falling trend and things are not looking good for the company. As the second bottom is formed, the pessimism is reduced. Many are positively surprised when the stock does not fall below the previous bottom, and thus might not continue the falling trend. When the price breaks above the top between the bottoms, it breaks the resistance located there. Pessimism has been replaced with dawning optimism and a rising trend has begun.
A stock that has triggered a buy signal from a double bottom formation is indicated to rise further, for at least as much as the formation is high.
Details
Double bottom formations trigger false buy signals fairly often. This is especially the case when the formation is small, when the stock remains in a falling trend channel, and when volume development is negative. At buy signal from a double bottom formation the stock as a whole should be assessed, not solely the buy signal. Many investors have bought losing stocks too soon following weak signals from double bottom formations. The following applies:
- Large double bottom formations are stronger than small ones.
- Buy signals with positive volume development are stronger than buy signals with negative volume development.
- Buy signals with a clear break through a falling trend, including break above the previous pivot top, are stronger than without breaks through trend and pivot top.
Investtech-Research: Buy signal from double bottom formation
Aktien mit solchen kaufsignale haben sich in den Monaten danach im Durchschnitt schwächer als der Markt entwickelt. Die annualisierte Rendite lag 2.0 Prozentpunkte (%p) unter dem Referenzindex.
| Annualisierte Rendite (basierend auf 66 Tagen) | |
| Kaufsignale mittlere sicht | 7.5% |
| Referenzindex | 9.5% |
| Mehrrendite | -2.0%p |
Diese Analyseergebnisse basieren auf 2317 Signalen für nordische Aktien im Zeitraum 2008-2020.
Mehr dazu hier
- Researchbericht: Investtech Research: Return following signals from double top/bottom formations in stock prices - medium term, Nordic markets 1996-2018 (Erforderliche Benutzerebene: PRO)
- Researchartikel: Investtech-forskning: Kjøpssignaler fra kortsiktige dobbel bunn-formasjoner går mot etablert teknisk analyse-teori
- Researchbericht: Investtech-forskning: Kursformasjoner - signalstatistikk Norden 2008-2020 (Erforderliche Benutzerebene: PRO)
- Researchartikel: Investtech-forskning: Kursformasjoner 2008 - 2020
Sell signal from double top formation
A sell signal from a double top formation signals increasing pessimism among investors and the beginning of a falling trend.
A double top formation is a top formation which marks the end of a rising trend. The formation consists of two tops of about the same height. The sell signal is triggered when the price breaks down below the tops.

At the first top, investors are optimists. The trend is rising and things are looking good for the company. As the second top is formed, the optimism wanes. Many are disappointed when the stock does not reach above the previous top and thereby possibly does not continue the rising trend. When the price breaks down below the bottom between the two tops, the support there is broken. Optimism has been replaced with pessimism and a falling trend has begun.
A stock that has triggered a sell signal from a double top formation is indicated to continue falling, for at least as long as the formation is high.
Details
False sell signals are triggered fairly often from double top formations. This is especially the case when it is a small formation, when the stock is still in a rising trend channel and when volume development is positive. At a sell signal from a double top formation the stock as a whole should be assessed, not solely the sell signal. Many investors have sold long term winners too soon following weak signals from double top formations. The following applies:
- Big double top formations are stronger than small ones.
- Sell signals with negative volume development are stronger than sell signals with positive volume development.
- Sell signals with a clear break down from a rising trend, including break below the previous pivot bottom, are stronger than if the trend and pivot bottom have not been broken.
Investtech-Research: Sell signal from double top formation
Aktien mit solchen verkaufssignale haben sich in den Monaten danach im Durchschnitt besser als der Markt entwickelt. Die annualisierte Rendite lag 1.8 Prozentpunkte (%p) über dem Referenzindex.
| Annualisierte Rendite (basierend auf 66 Tagen) | |
| Verkaufssignale mittlere sicht | 13.4% |
| Referenzindex | 11.6% |
| Mehrrendite | 1.8%p |
Diese Analyseergebnisse basieren auf 2987 Signalen für nordische Aktien im Zeitraum 2008-2020.
Mehr dazu hier
- Researchbericht: Investtech Research: Return following signals from double top/bottom formations in stock prices - medium term, Nordic markets 1996-2018 (Erforderliche Benutzerebene: PRO)
- Researchartikel: Investtech-forskning: Salgssignaler fra dobbel topp-formasjoner har liten signalkraft
- Researchbericht: Investtech-forskning: Kursformasjoner - signalstatistikk Norden 2008-2020 (Erforderliche Benutzerebene: PRO)
- Researchartikel: Investtech-forskning: Kursformasjoner 2008 - 2020
Die Anlageempfehlungen werden von Investtech.com AS ("Investtech") ausgearbeitet. Investtech übernimmt keine Haftung für die Vollständigkeit oder Richtigkeit der jeweiligen Analyse. Ein etwaiges Engagement aufgrund der aus den Analysen resultierenden Empfehlungen/Signale erfolgt zur Gänze für Rechnung und Risiko des Anlegers. Investtech haftet nicht für Verluste, die sich direkt oder indirekt infolge der Nutzung von Investtechs Analysen ergeben. Angaben zu etwaigen Interessenkonflikten gehen stets aus der Anlageempfehlung hervor. Weitere Informationen zu Investtechs Analysen finden Sie unter disclaimer.
Die Anlageempfehlungen werden von Investtech.com AS ("Investtech") ausgearbeitet. Investtech übernimmt keine Haftung für die Vollständigkeit oder Richtigkeit der jeweiligen Analyse. Ein etwaiges Engagement aufgrund der aus den Analysen resultierenden Empfehlungen/Signale erfolgt zur Gänze für Rechnung und Risiko des Anlegers. Investtech haftet nicht für Verluste, die sich direkt oder indirekt infolge der Nutzung von Investtechs Analysen ergeben. Angaben zu etwaigen Interessenkonflikten gehen stets aus der Anlageempfehlung hervor. Weitere Informationen zu Investtechs Analysen finden Sie unter disclaimer.


 Oslo Børs
 Stockholmsbörsen
 Københavns Fondsbørs
 Helsingin pörssi
 World Indices
 US Stocks
 Toronto Stock Exchange
 London Stock Exchange
 Euronext Amsterdam
 Euronext Brussel
 DAX
DAX CAC 40
 Mumbai S.E.
 Commodities
 Currency
 Cryptocurrency
 Exchange Traded Funds
 Investtech Indices