
 Oslo Børs
 Stockholmsbörsen
 Københavns Fondsbørs
Investeringsforeninger
Københavns Fondsbørs
Investeringsforeninger
 Helsingin pörssi
 World Indices
 US Stocks
US 30
Nasdaq 100
US 500
US Stocks
US 30
Nasdaq 100
US 500
 Toronto Stock Exchange
 London Stock Exchange
 Euronext Amsterdam
 Euronext Brussel
 DAX
SDAX
TECDAX
CDAX
MDAX
Prime Standard
DAX
SDAX
TECDAX
CDAX
MDAX
Prime Standard
 CAC 40
 Mumbai S.E.
National S.E.
Mumbai S.E.
National S.E.
 Commodities
 Currency
 Cryptocurrency
 Exchange Traded Funds
 Investtech Indices
Research Results Stocks in Rising and Falling Trends in the Medium Long Term
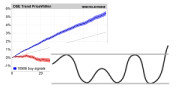
We have studied how stocks that were in a rising or falling trend at one time have developed over the next three months. Stocks in rising trends were assigned buy signals and stocks in falling trends were assigned sell signals.

a) Norway.

b) Sweden.

c) Denmark.

d) Finland.
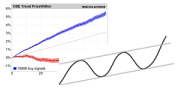
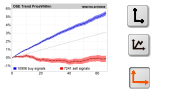
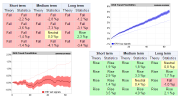
Figure 1: Average price development 66 days after the stocks were in rising trends (blue line) and falling trends (red line) in Investtechs medium long term technical charts. The width of the shaded area is one standard deviation from the average estimator the narrower the variance area, the better the estimate. Average benchmark development is the black line. Click the images for bigger versions.
| Average return after 66 days | Norway | Sweden | Denmark | Finland | Weighted average |
| Buy signal, stock in rising tend | 5.4 % | 5.5 % | 5.5 % | 2.7 % | 5.3 % |
| Sell signal, stock in falling trend | -0.1 % | 2.0 % | -1.7 % | 0.5 % | 1.3 % |
| Benchmark index | 3.1 % | 4.0 % | 3.2 % | 2.5 % | 3.5 % |
| Relative return | Norge | Sverige | Danmark | Finland | Weighted average |
| Buy signal, stock in rising tend | 2.3 ppt | 1.5 ppt | 2.3 ppt | 0.2 ppt | 1.9 ppt |
| Sell signal, stock in falling trend | -3.2 ppt | -2.0 ppt | -4.9 ppt | -2.0 ppt | -2.2 ppt |
ppt: percentage points. The difference between average return from stocks that have triggered signals and average benchmark development.
Stocks in rising trends have a clearly positive price development the next 66 days on average, and price development clearly better than average benchmark development. Similarly stocks in falling trends have developed far weaker than benchmark in the next 66 days.
The calculations are done based on a large data set for a relatively long time period and for four different countries. The uncertainty of the estimate, measured by standard deviation, is fairly low, with high statistical T values. The results are considered robust in spite of the lack of independence between samples (see the Data and Signals section).
If you want to learn more....
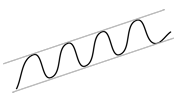
Rising trend.
Read the theory and see which stocks are in a rising trend right now.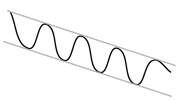
Falling trend.
Read the theory and see which stocks are in a falling trend right now.


Die Anlageempfehlungen werden von Investtech.com AS ("Investtech") ausgearbeitet. Investtech übernimmt keine Haftung für die Vollständigkeit oder Richtigkeit der jeweiligen Analyse. Ein etwaiges Engagement aufgrund der aus den Analysen resultierenden Empfehlungen/Signale erfolgt zur Gänze für Rechnung und Risiko des Anlegers. Investtech haftet nicht für Verluste, die sich direkt oder indirekt infolge der Nutzung von Investtechs Analysen ergeben. Angaben zu etwaigen Interessenkonflikten gehen stets aus der Anlageempfehlung hervor. Weitere Informationen zu Investtechs Analysen finden Sie unter disclaimer.
Die Anlageempfehlungen werden von Investtech.com AS ("Investtech") ausgearbeitet. Investtech übernimmt keine Haftung für die Vollständigkeit oder Richtigkeit der jeweiligen Analyse. Ein etwaiges Engagement aufgrund der aus den Analysen resultierenden Empfehlungen/Signale erfolgt zur Gänze für Rechnung und Risiko des Anlegers. Investtech haftet nicht für Verluste, die sich direkt oder indirekt infolge der Nutzung von Investtechs Analysen ergeben. Angaben zu etwaigen Interessenkonflikten gehen stets aus der Anlageempfehlung hervor. Weitere Informationen zu Investtechs Analysen finden Sie unter disclaimer.
Copyright Ⓒ 1997-2024 Investtech.com AS, Org nr 978 655 424 MVA Datenschutzerklärung | Haftungsausschluss
Zentrale
Strandveien 171366 Lysaker, Norway
Forschungsabteilung
Instituttveien 102007 Kjeller, Norway