
 Oslo Børs
 Stockholmsbörsen
 Københavns Fondsbørs
Investeringsforeninger
Københavns Fondsbørs
Investeringsforeninger
 Helsingin pörssi
 World Indices
 US Stocks
US 30
Nasdaq 100
US 500
US Stocks
US 30
Nasdaq 100
US 500
 Toronto Stock Exchange
 London Stock Exchange
 Euronext Amsterdam
 Euronext Brussel
 DAX
SDAX
TECDAX
CDAX
MDAX
Prime Standard
DAX
SDAX
TECDAX
CDAX
MDAX
Prime Standard
 CAC 40
 Mumbai S.E.
National S.E.
Mumbai S.E.
National S.E.
 Commodities
 Currency
 Cryptocurrency
 Exchange Traded Funds
 Investtech Indices
Bitcoin wakes up from sleep, gains over 20 per cent in two days
Published April 03, 2019
Commodities have had a good quarter in Q1 2019 with Bloomberg Commodity Index rising from 160.30 points in the beginning of 2019 to 169.82 points by the end of March, giving a positive return of 8.4 per cent. In the cryptocurrency space, Bitcoin just got a wake-up call and showed a significant gain of almost 20 per cent in only two days' time.
Those who study inter-market relationships to predict market movement can always look at historical price charts to see the level of correlation between commodity and stock markets. This may not be possible with the cryptocurrency market as it is relatively new and does not have enough historical data to draw any correlation or conclusion.
We look at the medium term charts of Bitcoin, Brent Crude Nymex and Gold futures and how they have behaved in the recent past and are likely to behave in the near future.
Bitcoin (BTC.CPT) Close: 4957.52
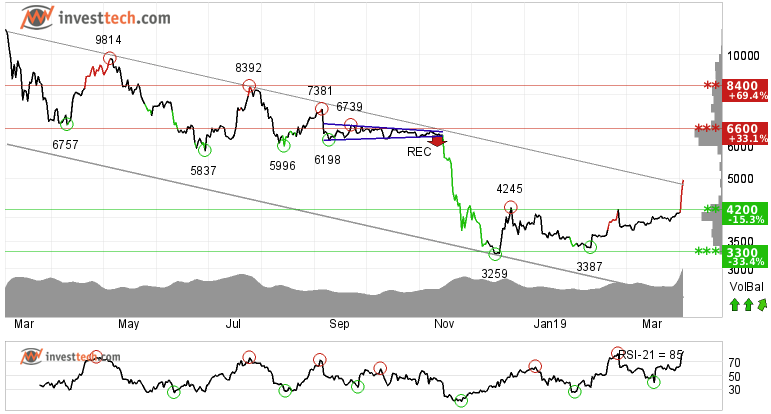
The cryptocurrency benchmark Bitcoin gave a surprise two days ago by gaining over 13 per cent on Monday and 6 per cent on Tuesday. It broke above its downtrend channel in the medium term. In the first place, a breakout from falling trend channel indicates either a slower rate of fall or possibly development of a sideways trend. It has now risen above its resistance of 4200 dollars. In the short term chart it has sharply broken above the rising trend channel on high volume. There is now support at 4200 and resistance at 6600. Hence reward to risk ratio is favourable.
Positive volume balance, with high volume on days with rising prices and low volume on days with falling prices, strengthens the cryptocurrency. RSI above 70 shows that there is strong positive momentum in the short term. Investors have steadily paid more to buy the crypto, which indicates increasing optimism and that the price may continue to rise. Positive volume balance and strong momentum make Bitcoin a weak buy instead of a watch in Investtech's short and medium term charts.
Investtech's outlook (one to six months): Weak Buy
Brent Crude NYMEX (BZ.FUT) Close: 69.45
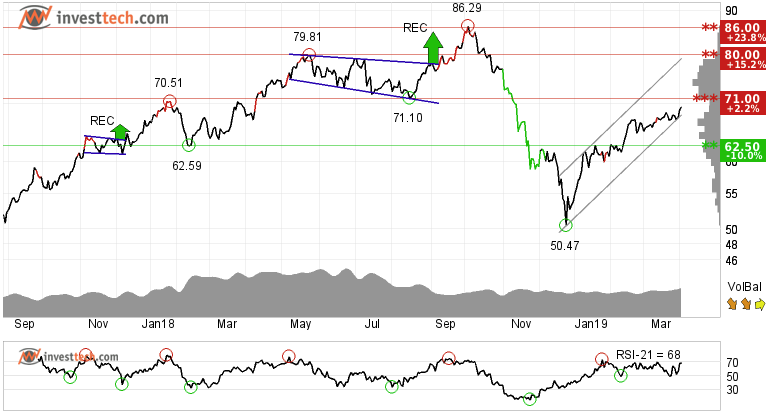
Investors have paid higher prices over time to buy Brent Crude NYMEX and the futures contract is in a rising trend channel both in the medium and long term. This signals increasing optimism among investors. Further rise is anticipated.
The commodity bottomed out right before Christmas 2018 and has gained around 37.5 per cent in the past three months. It is very close to its earlier resistance of 71 dollars, which can give the commodity a reaction downwards. However, if broken on the upside then the price can rise up to 80 dollars which is 15.2 % higher than yesterday's close. There is support between 67 and 64.80 dollars in the short term.
Investtech's outlook (one to six months): Weak Buy
Gold (GC.FUT) Close: 1290.00
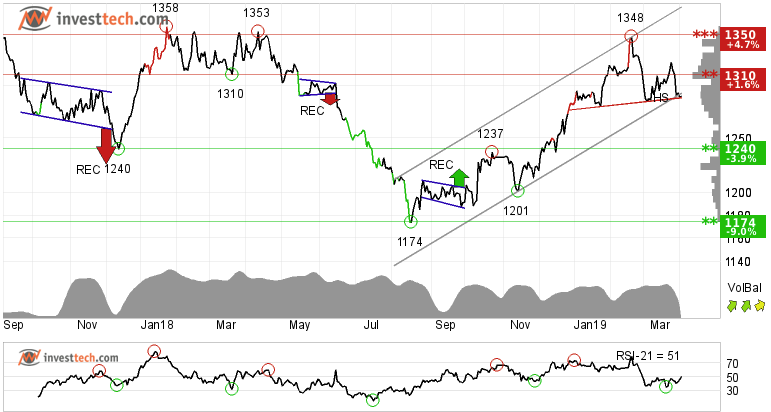
Gold futures made a low in September last year and established their recent peak in February. Gold prices gained by around 15 per cent before they decided to shed some of the gains and fell nearly 4 per cent from the peak of 1348 dollars to close at 1290 dollars per ounce.
Gold prices are currently testing support at the bottom of the rising trend channel and are constructing a potential head and shoulders formation. The price has already broken support at 1310 dollars. A break down and close below 1280 dollars may initiate fresh selling in Gold. But if buyers manage to reverse and take the prices back in the trend channel and preferably above 1310, then it will be safe to invest in this commodity again. If the prices dive south then there is support at 1240 dollars.
Investtech's outlook (one to six months): Watch
The analyses are based on closing price as per April 02, 2019
Note: These instruments are traded in currency based on the exchange or country they are listed on.
Verfasst von

Analyst
Investtech
"Investtech analysiert die Psychologie des Marktes und macht Ihnen täglich konkrete Tradingvorschläge."

Partner & Senior Advisor - Investtech

Die Anlageempfehlungen werden von Investtech.com AS ("Investtech") ausgearbeitet. Investtech übernimmt keine Haftung für die Vollständigkeit oder Richtigkeit der jeweiligen Analyse. Ein etwaiges Engagement aufgrund der aus den Analysen resultierenden Empfehlungen/Signale erfolgt zur Gänze für Rechnung und Risiko des Anlegers. Investtech haftet nicht für Verluste, die sich direkt oder indirekt infolge der Nutzung von Investtechs Analysen ergeben. Angaben zu etwaigen Interessenkonflikten gehen stets aus der Anlageempfehlung hervor. Weitere Informationen zu Investtechs Analysen finden Sie unter disclaimer.
Die Anlageempfehlungen werden von Investtech.com AS ("Investtech") ausgearbeitet. Investtech übernimmt keine Haftung für die Vollständigkeit oder Richtigkeit der jeweiligen Analyse. Ein etwaiges Engagement aufgrund der aus den Analysen resultierenden Empfehlungen/Signale erfolgt zur Gänze für Rechnung und Risiko des Anlegers. Investtech haftet nicht für Verluste, die sich direkt oder indirekt infolge der Nutzung von Investtechs Analysen ergeben. Angaben zu etwaigen Interessenkonflikten gehen stets aus der Anlageempfehlung hervor. Weitere Informationen zu Investtechs Analysen finden Sie unter disclaimer.
Copyright Ⓒ 1997-2024 Investtech.com AS, Org nr 978 655 424 MVA Datenschutzerklärung | Haftungsausschluss
Zentrale
Strandveien 171366 Lysaker, Norway
Forschungsabteilung
Instituttveien 102007 Kjeller, Norway