Investtech's Research
Investtech's systems are built on research dating back to 1994, and several projects have received support from the Research Council of Norway. Our research is based on principles from mathematical pattern recognition, statistical optimisation and behavioural finance. Our most important goal is to identify circumstances that can give investors robust excess return over time.The Chief Indicator is Trend
Investtech's research shows that stocks in rising trends give a good indication that they will continue upwards. And not only that; they will rise more than benchmark index.Research report: Stocks in rising trends have given excess return
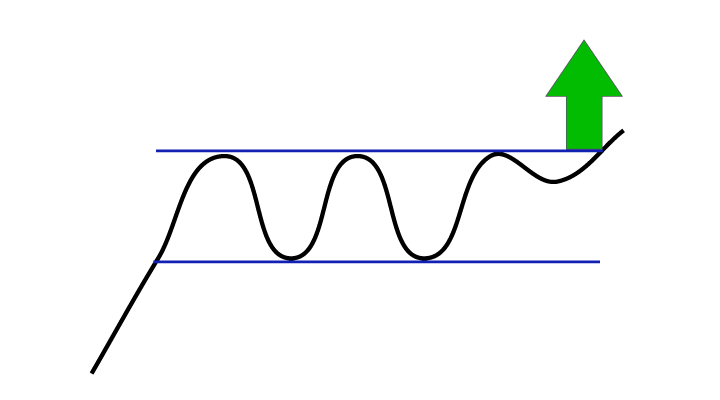
Rectangle Formations give Good Signals
Positive signals from rectangle formations are robust and reliable, with a hit rate of nearly 70 per cent.Read the research report here: Return following signals from rectangle formations - The Nordic markets 1996-2018
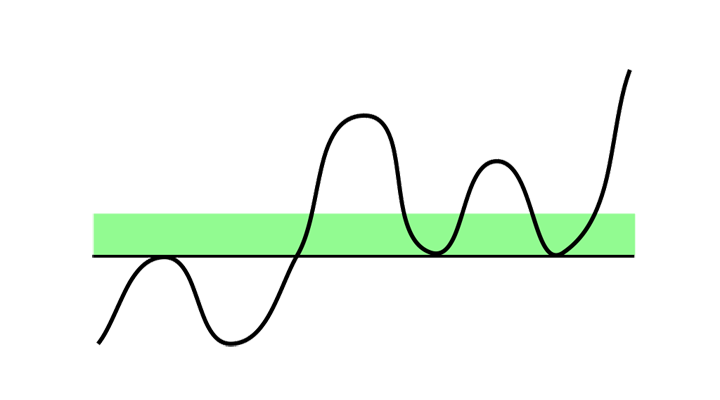
Investtech Research: Support and Resistance
Support and resistance are among the most important elements of technical analysis. In some areas our research findings are in accordance with the theory, while other findings indicate that the theory is weak or even wrong.Read the research report here: Support and Resistance: Return following testing of and breaks through support and resistance in stock prices, the Nordic markets, 1996-2018
RSI: A New Perspective
Investtech's research indicates that overbought RSI statistically is a strong positive signal, quite contrary to common usage of this indicator.Read the research report here >>
Volum is an Underestimated Technical Indicator
Many investors do not emphasise volume when doing technical analysis, and mostly look for patterns in price development. Investtech's research shows that volume balance, our indicator for covariance between price and volume, historically has been a good indicator for future price movements. Read more here!Read our research report on how volume balance can predict price movements on the Nordic markets.
Seasonal Variations on the Stock Exchange
Investtech’s statistics based on three decades of data show that the Scandinavian stock exchanges rise from early winter until early summer.Seasonal variations on the Scandinavian Stock Exchanges >>
Good Statistical Results with Today's Case
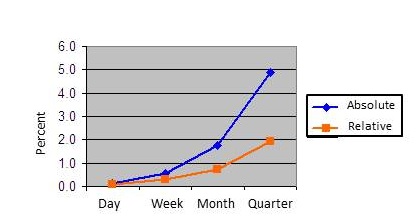
Statistics show that Investtech's Today's Case stocks on the German market increased by 4.3 per cent in a quarter, which is 1.2 percentage points better than index.Read the report here >>
The Trend Bible
Investtech has studied 350,297 signals from trends in stock prices on the Nordic stock exchanges in the period 1996 to 2015. The results largely confirm technical stock analysis theory: stocks in rising trends continue to rise!The Trend Bible - Everything you need to know to make investments based on trends.
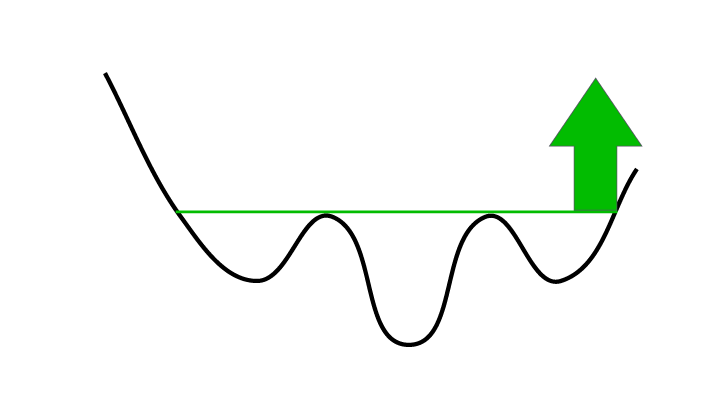
Inverse Head and Shoulders Formations
New research results from Investtech show that annualised excess return following buy signals from inverse head and shoulders formations in the medium term was 13.7 percentage points in the period 1996-2018.Excess return following buy signals from inverse head and shoulders formations
To the news archive
"For 20 years, our mathematicians and statisticians have developed computer systems that analyse market psychology. Investtech's analyses are independent of investments firms, banks and the stock companies, and make an important complementary addition to, or replacement for, fundamental analyses."

Head of Research and Analyses
What is technical analysis?
- Analysis of market psychology
- A timing tool, which says when to buy a stock
- A stock picking tool, which says which stocks to buy
- Identification of trends and buy and sell signals
- Technical analysis is the study of historical price development aiming to predict future price development.
- It is built on the principle that investors act from greed and fear and that investors as a group repeatedly make the same mistakes again and again.
- Studying price charts can reveal the psychological state of investors and its likely future development.
- Thus technical analysis is often used as a timing tool for the purchase and sale of stocks.
- Technical analysis is also used by many as a screening tool to find current buy cases.
- In addition, technical analysis is used as a monitoring tool which says when the sentiment of a stock changes, generally through identification of concrete buy and sell signals.
- Using computers to carry out the analyses makes the results entirely objective, unlike analyses from most investments firms and in the media, which are subjectively written by people.
- Investtech offers tools that make it easy to get started using technical analysis.
Articles and research reports:
- Research into the Nordic stock markets: Negative excess return after break downwards from falling trend
- Research into the Nordic stock markets: Excess return after break upwards from rising trend
- Research into the Nordic stock markets: Negative excess return from stocks in falling trend
- Research into the Nordic stock markets: Excess return from stocks in rising trends
- Research into the Nordic stock markets: Price formations - Overview
- Research into the Nordic stock markets: Sell signals from double top formations have little signal power
- Research into the Nordic stock markets: Buy signals from short term double bottom formations contradict established technical analysis theory
- Research into the Nordic stock markets: Variable predictive power in sell signals from head and shoulders formations
- Research into the Nordic stock markets: Excess return following buy signals from inverse head and shoulders formations
- Investtech Research: Support and Resistance - Summary
- Support and Resistance: Break upwards through resistance is a buy signal
- Research into the Nordic stock markets: Strong excess return following buy signals from rectangle formations
- Support and Resistance: Research results cause doubt about buy signals
- Support and Resistance: Buy signal when stock is above support and lacks resistance
- Research into the Nordic stock markets: Return as a result of price position in the trend channel
- Research into the Indian stock market: Volume balance is a reliable indicator
- Research into the Indian stock market: Signals from Rectangle formations
- Research into the Indian stock market: Stocks in rising trends have given excess return
- Research into the Nordic stock markets: Stocks in rising trends have given excess return
- Research into the Nordic stock markets: RSI is a good momentum indicator
- Research into the Indian stock market: RSI is a good momentum indicator
- Head and shoulders formations have low predictive power in the short term
- Short term double bottom/top formations contradict technical analysis theory
- Return following signals from short term rectangle formations
- Double bottom/top formations have low predictive power in the medium long term
- Head and shoulders formations have low predictive power in the medium long term
- Return following signals from long term rectangle formations
- Overbought RSI – Preliminary Research Results
- Buy before December – Seasonal variations on the Scandinavian Stock Exchanges
- High and Low Volume Balance - Preliminary Research Results
- Signals from long term double top and double bottom formations, Oslo Stock Exchange 1996-2014
- Results of signals from long term head and shoulders formations
- Buy signals from rectangle formations gave 6.2 per cent in three months
- Research report: Buy signal from rising trend
- Results of active trading following a period of falling stock exchanges
- 67 % success for buy signals from rectangle formations
To reports archive
Investtech guarantees neither the entirety nor accuracy of the analyses. Any consequent exposure related to the advice / signals which emerge in the analyses is completely and entirely at the investors own expense and risk. Investtech is not responsible for any loss, either directly or indirectly, which arises as a result of the use of Investtechs analyses. Details of any arising conflicts of interest will always appear in the investment recommendations. Further information about Investtechs analyses can be found here disclaimer.
The content provided by Investtech.com is NOT SEC or FSA regulated and is therefore not intended for US or UK consumers.


 Oslo Børs
 Stockholmsbörsen
 Københavns Fondsbørs
 Helsingin pörssi
 World Indices
 US Stocks
 Toronto Stock Exchange
 London Stock Exchange
 Euronext Amsterdam
 Euronext Brussel
 DAX
DAX CAC 40
 Mumbai S.E.
 Commodities
 Currency
 Cryptocurrency
 Exchange Traded Funds
 Investtech Indices


