Highest close since Jan 3.
 The market moved up Thursday, and Nifty 50 ended at 23852 points, which is an increase of 1.8 percent. The index has not closed higher since Jan 3. The index has now closed up for the fourth day in a row and this past week the index has gained as much as 5.8 percent. The index triggered a buy signal by the break up through the resistance at 23641 points in inverse head and shoulders formation. A further increase to 25385 points within four months is indicated. 818 shares showed a gain and 493 showed a loss. 12 shares were unchanged and closed at the same price as the previous day. There was no trading in 12 shares. Total value of the trading volume for shares and primary capital certificates Thursday was approximately 770.1 billion. | |
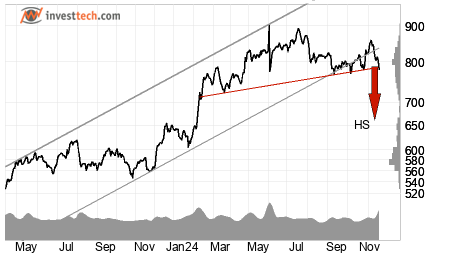 State Bank of India closed up 3.3 percent to 797 rupee. We must go back to Jan 2 to find a higher close for the stock. The stock has now closed up for the fourth day in a row. The stock triggered a buy signal by the break up through the resistance at 782 rupee in inverse head and shoulders formation. A further increase to 885 rupee within three months is indicated.
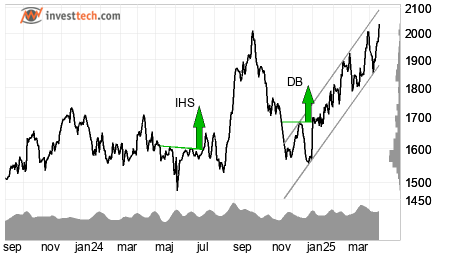 Bajaj Finserv Limited developed positively, and gained 3.4 percent to a close of 2035 rupee. The stock thereby broke the previous record from Sep 2024 and set a new all time high. The stock has now closed up for the fourth day in a row and this past week the stock has gained as much as 6.9 percent. Technically it also looks good. The stock is trend wise positive in the medium term, has broken up through resistance at 2000 rupee and a further increase is indicated.
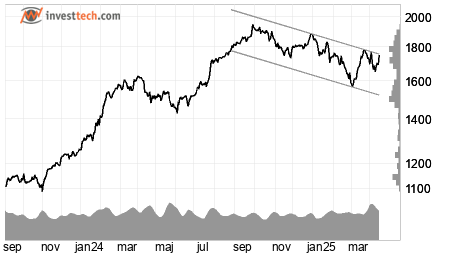 Sun Pharmaceuticals Industries Limited closed at 1752 rupee after a solid gain of 3.4 percent. The stock has never gained more in one day since Jun 5. 2024, when it was up 4.0 percent. The stock is trend wise negative in the medium term, but has marginally broken up through resistance at 1730 rupee.
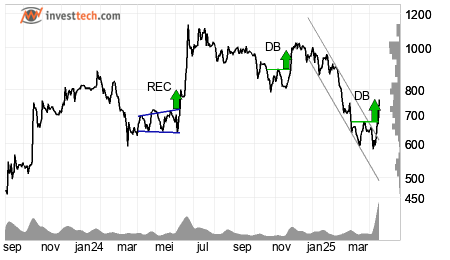 Fertilizers and Chemicals Travancore Lim closed at 761 rupee after posting a gain of 13.8 percent. We must go back to Jun 20. 2024 to find an equally strong rise. That time the stock gained 20.0 percent. The stock triggered a buy signal by the break up through the resistance at 677 rupee in double bottom formation. A further increase to 761 rupee within two months is indicated. The volume was also very high. At session end it was bought and sold shares for about 13126 million rupee in the stock, which equals 41 times mean daily turnover.
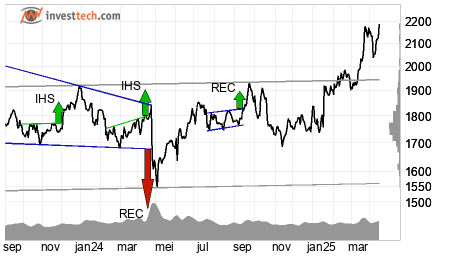 Kotak Mahindra Bank Limited closed up 3.0 percent to 2188 rupee. We must go back to Oct 2021 to find a higher close for the stock. The stock has now risen for the fourth day in a row. Technically it also looks good. The stock is trend wise positive in the medium term, has support at 1930 rupee and a further increase is indicated.
|
Winners Thursday
| Fertilizers and Chemicals | 13.82% |
| Oswal Agro Mills Ltd. | 13.11% |
| SMS Lifesciences India Ltd | 13.02% |
| Ashima Limited | 12.93% |
| Libas Designs Ltd. | 11.36% |
Losers Thursday
| Akme Fintrade India Ltd | -88.76% |
| Rossell India Limited | -6.14% |
| Dynemic Products Ltd. | -6.08% |
| Sonata Software Limited | -6.07% |
| Kesoram Industries Limited | -5.12% |
Most traded Thursday
| HDFC Bank Limited | 34037.54 |
| ICICI Bank Limited | 24603.78 |
| State Bank of India | 21558.92 |
| Bharti Airtel Limited | 20580.47 |
| Infosys Limited | 20248.07 |
Investtech guarantees neither the entirety nor accuracy of the analyses. Any consequent exposure related to the advice / signals which emerge in the analyses is completely and entirely at the investors own expense and risk. Investtech is not responsible for any loss, either directly or indirectly, which arises as a result of the use of Investtechs analyses. Details of any arising conflicts of interest will always appear in the investment recommendations. Further information about Investtechs analyses can be found here disclaimer.
The content provided by Investtech.com is NOT SEC or FSA regulated and is therefore not intended for US or UK consumers.


 Oslo Børs
 Stockholmsbörsen
 Københavns Fondsbørs
 Helsingin pörssi
 World Indices
 US Stocks
 Toronto Stock Exchange
 London Stock Exchange
 Euronext Amsterdam
 Euronext Brussel
 DAX
DAX CAC 40
 Mumbai S.E.
 Commodities
 Currency
 Cryptocurrency
 Exchange Traded Funds
 Investtech Indices