
 Oslo Børs
 Stockholmsbörsen
 Københavns Fondsbørs
Investeringsforeninger
Københavns Fondsbørs
Investeringsforeninger
 Helsingin pörssi
 World Indices
 US Stocks
US 30
Nasdaq 100
US 500
US Stocks
US 30
Nasdaq 100
US 500
 Toronto Stock Exchange
 London Stock Exchange
 Euronext Amsterdam
 Euronext Brussel
 DAX
SDAX
TECDAX
CDAX
MDAX
Prime Standard
DAX
SDAX
TECDAX
CDAX
MDAX
Prime Standard
 CAC 40
 Mumbai S.E.
National S.E.
Mumbai S.E.
National S.E.
 Commodities
 Currency
 Cryptocurrency
 Exchange Traded Funds
 Investtech Indices
Get started
Hvornår skal jeg købe?
Investtechs analyser hjælper dig med at beslutte, hvornår du skal købe en aktie. Investtechs grafer analyserer de psykologiske svingninger i markedet. Når optimismen er øgende, ses det i graferne. Nedenfor vises nogle klassiske situationer med aktier, som er teknisk positive. Se efter lignende signaler i graferne for at finde de aktier, du skal købe.
Stigende trend

- Køb aktier i stigende trend. Se rapport om trendsignaler!
- Positiv volumenbalance (VolBal) bekræfter den stigende trend.
Brud op fra kursformation

- Køb aktier, som giver købssignal fra rektangelformation eller omvendt-hode-og-skuldre-formation.
- Positiv volumenbalance bekræfter brud op fra kursformationer.
- Små dobbel-bunn-formasjoner gir ofte falske signaler, så vær varsom med disse.
Brud op gennem modstand

- Kjøp aksjer som har brutt opp gjennom motstand. De aller sterkeste signalene gis når det siste motstandsnivået i grafen er brutt, gjerne når kursen står i all time high.
- Køb aktier, som er faldet tilbage mod støtte, men bare når aktien bevæger sig i en sidelænds eller i en stigende trend.
- Positiv volumenbalance er et styrketegn.
- Vær forsigtig med køb nær støtte i faldende markeder, eller når volumenbalancen er negativ.
Hvornår skal jeg sælge?
Investtechs analyser hjælper dig med at beslutte, hvornår du skal sælge en aktie. Investtechs grafer analyserer de psykologiske svingninger i markedet. Når pessimismen er øgende, ses det i graferne. Nedenfor vises nogle klassiske situationer med aktier, som er teknisk negative. Du skal ikke købe sådanne aktier! Vær på vagt efter lignende signaler i aktier, du ejer.
Faldende trend

- Sælg aktier i faldende trender. Aktier i faldende trender falder statistisk over tid og udvikler sig dårligere end børsen. Se rapport om trendsignaler.
- Hvis du ejer en aktie, og trenden bliver faldende, sælg den!
- Negativ volumenbalance (VolBal) bekræfter den faldende trend.
Brud ned fra kursformation
- Sælg aktier, som giver salgssignal fra kursformation.
- Brud ned på kursformation signalerer, at optimismen hos investorerne er i færd med at ændres til pessimisme.
- Negativ volumenbalance bekræfter brud ned fra formationer. Stigende volumen forstærker salgssignalerne.
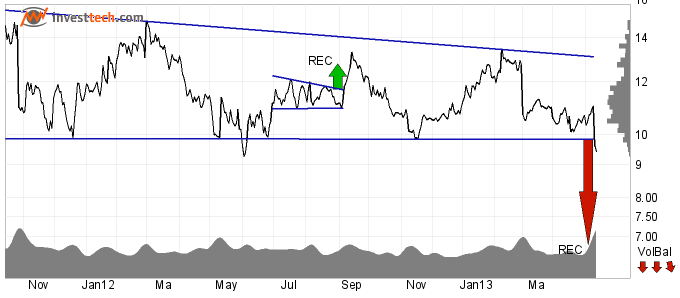
Brud ned gennem støtte

- Sælg aktier, som har brudt støtte.
- Brud gennem støtte signalerer, at investorerne bliver mere pessimistiske.
- Negativ volumenbalance bekræfter brud gennem støtte. Stigende volumen forstærker signalet.
Hvordan finder jeg købskandidaterne?
Investtech hjælper dig med at finde købskandidater. Nedenfor præsenteres nogle af Investtechs mest populære stock-picking-værktøjer. Abonnenter kan klikke på billederne for at få direkte adgang.
 |
Top50
|
 |
Handelsmuligheder
|
 |
Dagens Case
|
Hvordan analyserer jeg børsen?
Investtech hjælper dig med at analysere børsen. Herunder præsenteres nogle af Investtechs værktøjer til at analysere markedet. Abonnenter kan klikke på billederne for at få direkte adgang.
Sådan gør du:
- Analyser markedsindekset
- Analyser hausse-indekset og optimismen på børsen
- Analyser innsidehandel
 |
Markedsindekset
|
 |
Investtechs optimismeindeks
|
 |
Investtechs innsidebarometer
|
Worth knowing about Investtechs analyses
Investor psychology
We can interpret which psychological changes the investors have been through based on stock price fluctuations and trading volume. We can interpret what they are thinking now, or what mood they are in. This allows us to predict what they will probably do tomorrow or next month.
Trading today will then allow us to enter a stock before many other investors decide to buy, or to exit a stock before many other investors decide to sell.
Investtechs analyses aim to interpret the fluctuations of investor psychology and market tends in order to predict the future development of stock prices. We do this using powerful computers, a large database of historical observations and the theory of technical analysis and behavioural finance.
Automatic analyses
Investtech's automatic analyses are based on advanced methods within pattern recognition, statistics and mathematics, developed since 1993. Emphasis is especially placed upon trends, support and resistance, stock price formations and volume.
For each stock and for each time perspective, a chart is produced together with its associated analysis. By using traditional theory for technical analysis, see Technical Analysis - For reduced risks and increased returns, the computers interpret what they find in the chart and then create both the analyses, texts and the correct recommendations, entirely automatically. This leaves no room for subjective interpretation, which is a common problem with traditional technical analysis, where the analysts draw the trend, support and resistance lines, and then interpret them.
The recommendations from the automatic analyses are given as Positive Candidate, Weak Positive Candidate, Wait/Watch, Weak Negative Candidate and Negative Candidate. Some places, however, Technical score is used. Risk is also indicated.
The analyses are produced and published as soon as possible after the closing of the exchange, and no later than before the exchange's opening the following day.
Time Perspectives
Investtech has three time perspectives for our analysis charts and recommendations.
| Time Perspective | Chart | Investment Perspective |
| Short term | 5 months | 1-6 weeks |
| Medium term | 18 months | 1-6 months |
| Long term | 6 years | 1-6 quarters |
Investtech also provides Candlestick charts covering 21 days. This, combined with short and medium term analysis charts, we consider best suited for investments with 0-10 days perspective.
Investeringsaanbevelingen worden gedaan door Investtech.com AS ("Investtech"). Investtech garandeert geen volledigheid of juistheid van de analyses. Eventuele fouten in de aanbevelingen, koop- en verkoopsignalen en mogelijke negatieve gevolgen hiervan zijn geheel het risico van de belegger. Investtech neemt geen enkele verantwoordelijkheid voor verlies, direct of indirect, als gevolg van het gebruik van Investtechs analyses. Meer informatie omtrent Investtechs analyses kunt u vinden op disclaimer.
Investeringsaanbevelingen worden gedaan door Investtech.com AS ("Investtech"). Investtech garandeert geen volledigheid of juistheid van de analyses. Eventuele fouten in de aanbevelingen, koop- en verkoopsignalen en mogelijke negatieve gevolgen hiervan zijn geheel het risico van de belegger. Investtech neemt geen enkele verantwoordelijkheid voor verlies, direct of indirect, als gevolg van het gebruik van Investtechs analyses. Meer informatie omtrent Investtechs analyses kunt u vinden op disclaimer.
Hoofdkantoor
Strandveien 171366 Lysaker, Norway
Research-afdeling
Instituttveien 102007 Kjeller, Norway