
 Oslo Børs
 Stockholmsbörsen
 Københavns Fondsbørs
Investeringsforeninger
Københavns Fondsbørs
Investeringsforeninger
 Helsingin pörssi
 World Indices
 US Stocks
US 30
Nasdaq 100
US 500
US Stocks
US 30
Nasdaq 100
US 500
 Toronto Stock Exchange
 London Stock Exchange
 Euronext Amsterdam
 Euronext Brussel
 DAX
SDAX
TECDAX
CDAX
MDAX
Prime Standard
DAX
SDAX
TECDAX
CDAX
MDAX
Prime Standard
 CAC 40
 Mumbai S.E.
National S.E.
Mumbai S.E.
National S.E.
 Commodities
 Currency
 Cryptocurrency
 Exchange Traded Funds
 Investtech Indices
Important indices show that optimism prevails
Published 2014-09-03
Analyses of leading indices show that long-term optimism dominates the big stock exchanges.
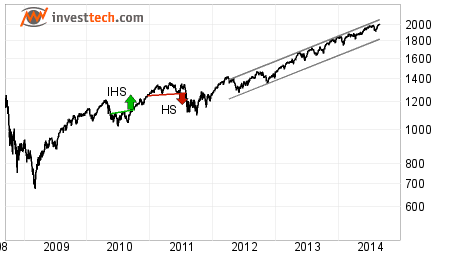 The S&P 500 with 500 of the biggest companies on the NYSE and NASDAQ exchanges is in a long-term rising trend. The index has reached an all-time high, and broke upwards through the psychologically important 2,000 points last week. This opens for further rise within the trend, which has an annual rate of increase of 17 percent.
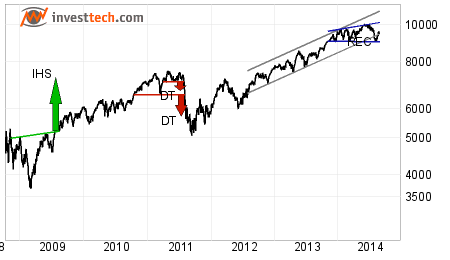
 The Hang Seng in Hong Kong is in a long-term rising trend. A buy signal was recently triggered when the index broke upwards through resistance at 24,000 points. The buy signal has a formation target of 30,000 points by the end of 2017.
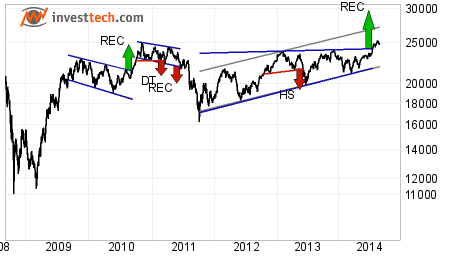
 The DAX consists of the 30 biggest companies on the stock exchange in Frankfurt. The index has risen comfortably in the past few years and is in a rising trend. However there is resistance at approx. 10,000 points which has restricted further rise this year. A rectangle formation is developing with support around 9,000 points and resistance around 10,000 points. If the index breaks upwards through 10,000 points, it will trigger a buy signal. If it instead experiences a reversal and breaks downwards below 9,000 points, a weaker market outlook in Germany will be indicated.
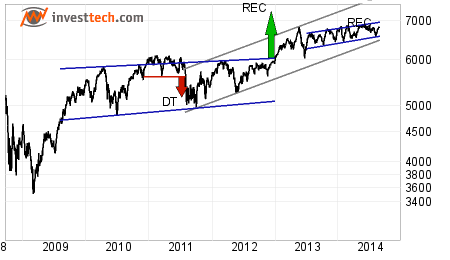 The FTSE is comprised of the 100 biggest companies on the London stock exchange. The index triggered a buy signal from a large rectangle formation when it broke upwards through resistance at 6,000 points in January 2013. The buy signal has a formation target of more than 7,200 points. So far this year, the index has had a more sideways development, and has established solid resistance around 6,800 points. The rising trend has marginally broken downwards, which indicates a more neutral market. Established trading above resistance at 6,800 7,000 points will indicate new optimism on the British stock exchange and signal further rise.
The analyses were written for publication in the Norwegian newspaper Dagens Næringsliv on 2 Sept 2014.
Written by

Analyst
at Investtech
"Investtech analyses the psychology of the market and gives concrete trading suggestions every day."

Partner & Senior Advisor - Investtech


Investtech guarantees neither the entirety nor accuracy of the analyses. Any consequent exposure related to the advice / signals which emerge in the analyses is completely and entirely at the investors own expense and risk. Investtech is not responsible for any loss, either directly or indirectly, which arises as a result of the use of Investtechs analyses. Details of any arising conflicts of interest will always appear in the investment recommendations. Further information about Investtechs analyses can be found here disclaimer.
The content provided by Investtech.com is NOT SEC or FSA regulated and is therefore not intended for US or UK consumers.
Head office
Strandveien 171366 Lysaker, Norway
Research department
Instituttveien 102007 Kjeller, Norway