Hyviä tuloksia Investtechin analyyseja käyttäen
- Riippumattomia puolueettomia analyyseja
- Konkreettisia osto- ja myyntisignaaleja
- Selkeitä suosituksia
- Tutkimus- ja raporttimateriaaleja
 Oslo Børs
 Stockholmsbörsen
 Københavns Fondsbørs
Investeringsforeninger
Københavns Fondsbørs
Investeringsforeninger
 Helsingin pörssi
 World Indices
 US Stocks
US 30
Nasdaq 100
US 500
US Stocks
US 30
Nasdaq 100
US 500
 Toronto Stock Exchange
 London Stock Exchange
 Euronext Amsterdam
 Euronext Brussel
 DAX
SDAX
TECDAX
CDAX
MDAX
Prime Standard
DAX
SDAX
TECDAX
CDAX
MDAX
Prime Standard
 CAC 40
 Mumbai S.E.
National S.E.
Mumbai S.E.
National S.E.
 Commodities
 Currency
 Cryptocurrency
 Exchange Traded Funds
 Investtech Indices
Four simple steps to learn about the models of technical analysis - Trend, Support & Resistance, Formations and Volume.

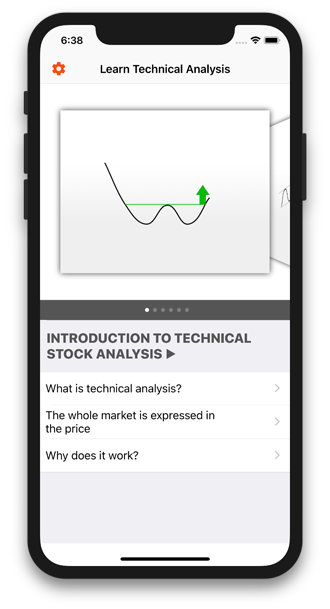

Identifying trends is one of the most important parts of technical analysis. Technical analysts will tell you that the trend is your friend.
To put it simply, support and resistance are price levels where price movements stop and reverse directions. Resistance is where the price often stops in rising movements; support is where the price often stops in falling movements.


A formation is a collection of resistance and support points that develop as a result of corrections in the trend. Resistance and support points combined form a visually recognisable formation in the price chart.
Refers to the number of stocks traded on the stock exchange, or turnover value in the relevant currency. Volume information gives the opportunity to assess the strength and reliability of a price movement. This is done by comparing the price movement to the volume development.

Investtech ei takaa analyysien tarkkuutta tai kattavuutta. Kaikkien analyysien tuottamien neuvojen ja signaalien käyttäminen on täysin käyttäjän vastuulla. Investtech ei vastaa mistään tappioista, jotka saattavat syntyä Investtechin analyysien käytön seurauksena. Mahdollisten eturistiriitojen yksityiskohdat mainitaan aina sijoitusneuvon yhteydessä. Lisätietoja Investtechin analyyseistä löytyy täältä disclaimer.
Investtech ei takaa analyysien tarkkuutta tai kattavuutta. Kaikkien analyysien tuottamien neuvojen ja signaalien käyttäminen on täysin käyttäjän vastuulla. Investtech ei vastaa mistään tappioista, jotka saattavat syntyä Investtechin analyysien käytön seurauksena. Mahdollisten eturistiriitojen yksityiskohdat mainitaan aina sijoitusneuvon yhteydessä. Lisätietoja Investtechin analyyseistä löytyy täältä disclaimer.