Trends
The trend is one of the most important indicators of technical analysis. According to technical analysis theory, stocks that are in rising trends will continue to rise, and stocks in falling trends will continue to fall. Investtech’s research shows that this theory is correct.
This makes it very important to identify whether a stock is in a rising or falling trend. It is also important to recognise when trends change, in order to get out early in the case of a falling trend and get in early in the case of a rising one.
The trend is a simple indicator to follow. Every day Investtech’s systems identify the qualitatively best trend for each stock. Stocks in rising trends should be bought and stocks in falling trends should be sold.
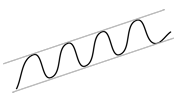
Buy and hold stocks in rising trends
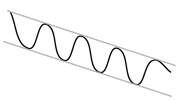
Sell and stay away from stocks in falling trends
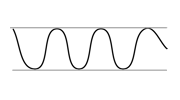
Stocks in sideways trends can be bought near the trend floor and sold near the trend ceiling
Main principles
The bottom line of trend analysis is simple: The trend is your friend.
- Buy and hold stocks in rising trends.
- Sell and stay away from stocks in falling trends.
- Stocks in sideways trends can be bought near the trend floor and sold near the trend ceiling.
Warning signals
- Price near trend floor indicates greater upside, but also greater risk of a break downward.
- Price near trend ceiling indicates a smaller upside, but also a greater chance of a break upward.
Trend breaks
It may appear that a stock should be sold when it breaks downwards from a rising trend. However, this often simply signals that the stock is taking a small break and will continue upwards soon. The following applies when assessing trend breaks:
- High volume strengthens a break and signals a possible trend reversal.
- Low volume indicates that the stock will soon continue in the same trend direction.
- For rising trends: break below previous bottom signals a reversal downward.
- For falling trends: break above the previous top signals a reversal upward.
How does Investtech identify a trend?
Investtech’s computer systems identify only one trend per graph. This is the qualitatively “best” trend in the chart. A good rising trend meets several of these criteria:
- The trend channel is long.
- The trend channel is narrow.
- The channel rises to a moderate degree (not too steep).
- The price has several points on or near the support line on the channel floor.
- The price has several points on or near the resistance line in the channel ceiling.
- The price has fairly even fluctuations within the channel.
- The price does not deviate much from an imagined straight line through the price points.
- Last closing price is near, or within, the trend channel.
A medium term price chart has some 80,000 potential trends. All of these are analysed based on the criteria above, and a score is calculated for each potential trend. The trend with the highest score is drawn in Investtech’s chart.
A trend can change between falling, rising and moving sideways from one day to the next. The trend channel gradient will usually be adjusted over time when new closing prices are added. This causes a stock to break out of the trend channel for a few days, and then return to it a few days later, when the trend channel is adjusted again.
Rising trend
Rising trends indicate that the company experiences positive development and increasing buy interest among investors.
 A rising trend signals that the stock will continue to rise. Trends often last longer than investors think, and consequently many sell too soon. If you own a stock in a rising trend, you should normally keep it. And you should consider buying stocks that are in rising trends if you are looking for new stocks to buy.
- Buy stocks in rising trends.
- Keep stocks you own while they are in rising trends.
A stock in a rising trend has investors who have become increasingly positive to the company. When this sort of movement has started among the investors, it tends to last over time. Ever more people see the positive development, make their own analyses, and thereby nurture further positive development.
The market often overreacts to short term news and underreacts to long term news. A contract today gives direct income in the short term. However, it also influences the company’s long term potential and chances of landing a new contract tomorrow. Stocks in positive trends therefore often continue to rise.
 The commercial development in companies often moves in long term cycles. Yet the market will respond in the short term to news and other impulses. A company with steady growth will tend to have low fundamental valuation near the floor of a trend channel, and a high valuation near the ceiling. Thus it can be advantageous to buy near the trend floor and sell near the trend ceiling. This means there is support near the trend floor and resistance near the trend ceiling.
The figure shows a stock in a rising trend where the fundamental key figure P/E (price-to-earnings ratio) fluctuates between 12 at the trend floor and 15 at the trend ceiling.
Warning signals for long term reversal downward
- Decreasing volume on rising prices and near tops.
- Increasing volume on falling prices and near bottoms.
- Price near floor, especially if the stock also sees horizontal resistance and negative volume development.
Warning signals for short term reaction downward
- Price near resistance and overbought RSI, and often negative volume development.
Should warning signals trigger a sale?
Rising trends often last longer than many investors think, and it is easy to sell too soon. However, sometimes selling at early trend reversal warning signals gives very good sales. What to do is a matter of risk assessment.
Investtech Research: Rising trend
Stocks with these ostosignaalit have on average outperformed the market in the following months. Annualised excess return has been 6.5 percentage points (pp). This is significantly better than benchmark.
| Annualised return (based on 66-day figures) | |
| Ostosignaalit keskipitkä tähtäin | 16.3% |
| Reference index | 9.7% |
| Excess return | 6.5pp |
The research results are based on 35097 signals from Nordic stocks in the period 2008-2020.
Lue lisää
- Research Report: Stocks in rising trends have given excess return in the Nordic countries (Vaadittu käyttäjätaso PRO)
- Research Article: Investtech Research: Trend signals better than theory suggests
- Research Report: Investtech Research: Rising and falling trends (Vaadittu käyttäjätaso PRO)
- Research Article: Investtech Research: Trend signals remain reliable
- Research Article: Buy signal from rising trend: Research results 2021-2023
Falling trend
Falling trends indicate that the company experiences negative development and that buy interest among investors is in decline.

Falling trends indicate that the stocks will continue to fall. Trends often last for longer than investors think they will, and thus many buy a stock too soon. If you own a stock in a falling trend, you should normally sell it. If you are looking to buy stocks, you should stay away from stocks that are in falling trends.
- Sell stocks you own that are in falling trends.
- Do not buy stocks that are in falling trends.
When a stock is in a falling trend, investors have become ever more negative to the company. When this sort of movement has started among the investors, it tends to last over time. Negative impulses are picked up by the media, analysts and investors, and tend to reinforce each other. This leads to further negative development.
The market often overreacts to short term news and underreacts to long term news. Problems with a contract or a product line today, gives direct loss of profit in the short term. However, it also influences the company’s long term potential and chance of more problems tomorrow. Stocks in falling trends therefore often continue to fall.

The commercial development in companies often moves in long term cycles. Yet the market will respond in the short term to news and other impulses. A company with shrinking markets or increasing competition and price pressure will tend to have low fundamental valuation near the floor of a trend channel, and a high valuation near the ceiling. For fundamental investors it can be advantageous to buy near the trend floor and sell near the trend ceiling. As such there is support near the trend floor and resistance near the trend ceiling.
The figure shows a stock in a falling trend where the fundamental key figure P/E (price-to-earnings ratio) fluctuates between 8 at the trend floor and 10 at the trend ceiling.
Warning signals for long term reversal upward
- Decreasing volume on falling prices and near bottoms.
- Increasing volume on rising prices and near tops.
- Price near ceiling, especially if the stock also sees horizontal support and positive volume development.
Warning signals for short term reaction upward
- Price near support with oversold RSI and often positive volume development.
Should warning signals trigger a purchase?
Falling trends often last longer than many investors think they will, and it is easy to buy too soon. Nevertheless, sometimes buying at early trend reversal warning signals gives very good purchases. The choice depends on risk assessment. Please note that it is easy to be fooled by very short term fluctuations. Keep investment horizon in mind and place less emphasis on analyses for other time horizons.
Buying stocks in falling trend channels is considered high risk, even if warning signals are triggered for a reversal upward. Investtech’s statistics show that stocks in falling trends keep falling in the short term, and underperform significantly in the long term.
Investtech Research: Falling trend
Stocks with these myyntisignaalit have on average underperformed compared to benchmark in the following months. Annualised negative excess return has been 5.8 percentage points (pp). This is significantly weaker than benchmark.
| Annualised return (based on 66-day figures) | |
| Myyntisignaalit keskipitkä tähtäin | 3.4% |
| Reference index | 9.2% |
| Excess return | -5.8pp |
The research results are based on 23289 signals from Nordic stocks in the period 2008-2020.
Lue lisää
- Research Report: Stocks in rising trends have given excess return in the Nordic countries (Vaadittu käyttäjätaso PRO)
- Research Report: Investtech Research: Rising and falling trends (Vaadittu käyttäjätaso PRO)
- Research Article: Investtech Research: Negative excess return from stocks in falling trends
- Research Article: Sell signal from falling trend: Research results 2021-2023
- Research Report: Investtech-forskning: Trender - signalstatistikk Norden 2019 og 2020 (Vaadittu käyttäjätaso PRO)
Horizontal trend
Horizontal trends indicate that the investor base is balanced. News and short term impulses will make the stock fluctuate in the short term, but it will remain near long term equilibrium.
 Stocks in horizontal trends signal continued sideways development.
Investors who bought when the stock was near the trend floor saw that the stock was cheap at the time, and may well buy again if the stock falls to the same level. This constitutes support at the floor. Similarly, investors who sold when the stock was near the trend ceiling may well remember this good sale and want to sell again. This constitutes resistance near the trend channel ceiling. Barring large changes for the company or in the market, the stock will carry on its sideways development.
Price near ceiling of rising trend
Rising trends indicate that the company experiences positive development and increasing buy interest among investors. Stocks in rising trends signal a further increase within the trend channel.
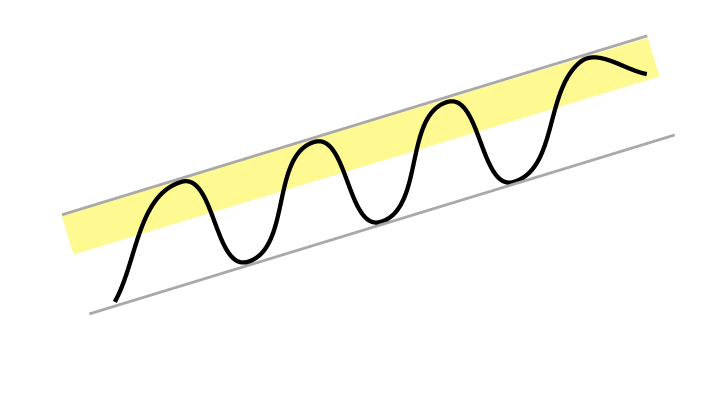 When the price is near the resistance of the trend channel ceiling, there is a large downside to the trend channel floor. The stock may then see short term falling prices.
However, selling near the ceiling can be a poor strategy, especially in the long term. Selling stocks for a profit too soon is one of the most common mistakes investors make. The price of a stock in a rising trend often increases for much longer than many investors think it will. Long term investors would therefore generally be wise to keep the stock, even if it is near the trend channel ceiling.
Selling near the ceiling of a rising trend can also be a poor short term strategy. When the price is close to the ceiling, there are good chances of a break upward, compared to the situation when the price is in the lower half of the trend channel. A break upward will be a buy signal and indicate a steeper rate of increase ahead. Consequently it will often be right also for short term investor to keep a stock near the trend channel ceiling.
The choice will depend on the investor’s risk analysis. Price near the trend ceiling gives a good chance for a break upward, but also a great chance for an imminent reaction downward.
In Investtech’s analyses, stocks in rising trends are counted as equally positive regardless of whether the price is near the floor, near the ceiling or in the middle of the trend channel. A stock is classified as “near trend ceiling” if it is in the upper fifth of the trend channel.
Rising trend breaking upwards
Rising trends indicate that the company experiences positive development and increasing buy interest among investors.
A rising trend signals that the stock will continue to rise. Trends often last longer than investors think, and consequently many sell too soon. If you own a stock in a rising trend, you should normally keep it. Are you looking for new stocks to buy, you should consider buying stocks that are in rising trends.
 A rising trend breaking upwards signals strongly increasing buy interest among investors. This can be initiated by fundamental aspects of the stock or via media or stock brokers focusing on the company, making more investors aware of it.
A break upward is often the start of a further rise, with an even steeper rate of increase than before.
Special circumstances
In some rare cases, especially if the trend has lasted for a long time and the volume is unusually high, a break upward can signal an end rally: everything looks positive and every investor wants in. This pushes the price up while the last investors buy into the stock. A price reduction after this, on high volume, is a clear warning of a negative reversal in the stock.
The main rule remains that a break upward through a rising trend is a positive signal.
In Investtech’s analyses, a stock in a rising trend and a stock that has broken upwards through a rising trend will both be equally positive, given they are otherwise identical.
Investtech Research: Rising trend breaking upwards
Stocks with these ostosignaalit have on average outperformed the market in the following months. Annualised excess return has been 9.8 percentage points (pp). This is significantly better than benchmark.
| Annualised return (based on 66-day figures) | |
| Ostosignaalit keskipitkä tähtäin | 17.3% |
| Reference index | 7.5% |
| Excess return | 9.8pp |
The research results are based on 6053 signals from Nordic stocks in the period 2008-2020.
Lue lisää
- Research Article: Investtech Research: Excess return after break upwards from rising trend
- Research Article: Investtech Research: Trend signals remain reliable
- Research Report: Investtech-forskning: Trender - signalstatistikk Norden 2019 og 2020 (Vaadittu käyttäjätaso PRO)
- Research Report: Investtech-forskning: Trender - signalstatistikk Norden 2008 - 2020 (Vaadittu käyttäjätaso PRO)
- Research Article: Investtech-forskning: Meravkastning etter kjøpssignal fra trend
Price near floor of rising trend
Rising trends indicate that the company experiences positive development and increasing buy interest among investors. Stocks in rising trends signal a further increase within the trend channel.
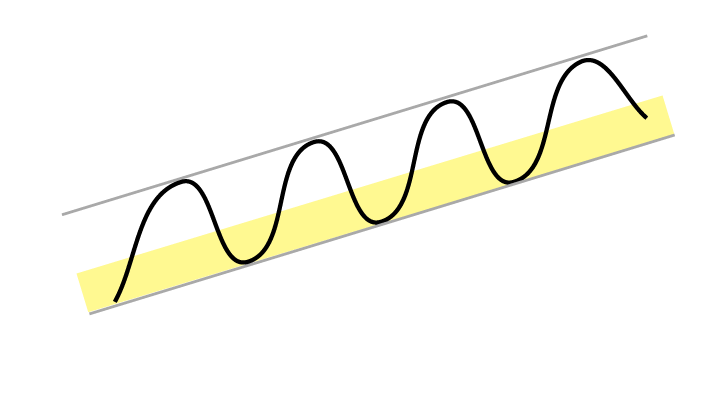 When the price is near the support of the trend channel floor, there is a large upside to the trend channel ceiling. The opportunity is there to make good purchases, if the trend development continues.
At the same time, the risk of a break downward is greater than when the stock is in the upper half of the trend channel. A break downward is not a sell signal, see the help item Rising trend breaking downwards, but the stock will be assessed as less positive than when the price is inside the trend channel.
Hence it is not obvious that it is better to buy a stock near the floor of a trend channel than to buy when it is in the middle or top of the channel.
In Investtech’s analyses, stocks in rising trends are counted as equally positive regardless of whether the price is near the floor, near the ceiling or in the middle of the trend channel. A stock is classified as “near trend floor” if it is in the lower fifth of the trend channel.
Rising trend breaking downwards
Rising trends indicate that the company experiences positive development and increasing buy interest among investors. Rising trends indicate that the stock will continue to rise. Trends often last longer than investors think, and consequently many sell too soon.
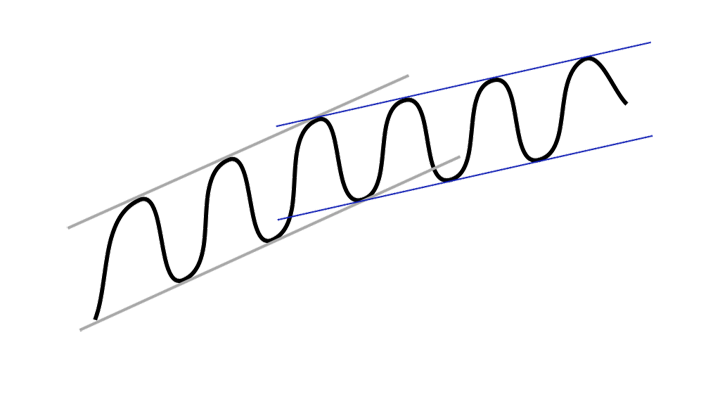 When a rising trend breaks downwards it signals a change in the rate of increase. Rising trends often begin with a steep rate of increase, which slows down over time. The company can still be in a long term positive development with optimism reaching ever new investment groups and analysts.
The figure shows what is normally the case when a rising trend breaks downwards. The original trend in black and the new trend in blue.
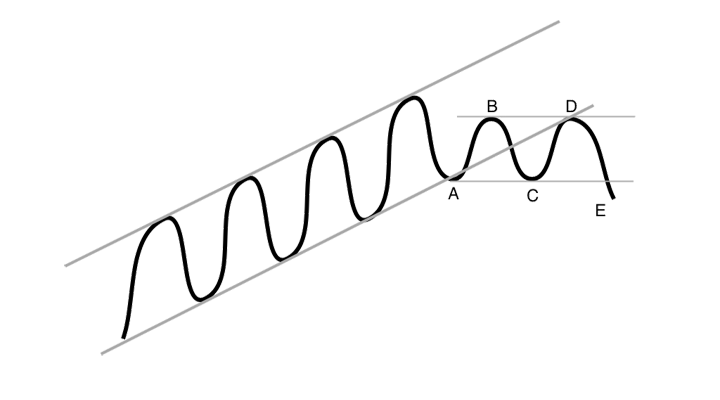 The figure shows the phases of how a trend reversal arises. Warning signals are triggered at the break downward through the trend floor, moving from B to C, while a sell signal is only triggered at point E, when the price is below that of the previous bottom.
Volume development matters
If a break downward occurs on neutral or decreasing volume, it is often simply a sign of passive investors. This is natural following a stream of positive news, and long term investors can use it to slowly increase their holding in the stock.
On the other hand, if the break downward occurs on increasing volume, it indicates that active sellers are pushing the price down in order to get rid of stocks. This signals a potential negative change in investor psychology and can be seen as an early sell signal. The sell signal is only confirmed when the stock price breaks downwards below the previous bottom in the price chart.
Investtech’s analyses will assign a stock in a rising trend breaking downwards only half the technical score of a stock in a rising trend.
Investtech Research: Rising trend breaking downwards
Stocks with these ostosignaalit have on average outperformed the market in the following months. Annualised return has been 2.3 percentage points (pp) better than benchmark.
| Annualised return (based on 66-day figures) | |
| Ostosignaalit keskipitkä tähtäin | 14.3% |
| Reference index | 12.0% |
| Excess return | 2.3pp |
The research results are based on 21567 signals from Nordic stocks in the period 2008-2020.
Lue lisää
- Research Article: Investtech Research: Trend signals remain reliable
- Research Report: Investtech-forskning: Brudd ned fra stigende trender og brudd opp fra fallende trender (Vaadittu käyttäjätaso PRO)
- Research Article: Investtech-forskning: Aksjer med brudd ned fra stigende trend fortsetter å stige
- Research Report: Investtech-forskning: Trender - signalstatistikk Norden 2019 og 2020 (Vaadittu käyttäjätaso PRO)
- Research Report: Investtech-forskning: Trender - signalstatistikk Norden 2008 - 2020 (Vaadittu käyttäjätaso PRO)
Price near ceiling of falling trend
Falling trends indicate that the company experiences negative development and decreasing buy interest among investors. Falling trends signal that the stock price will continue to fall.
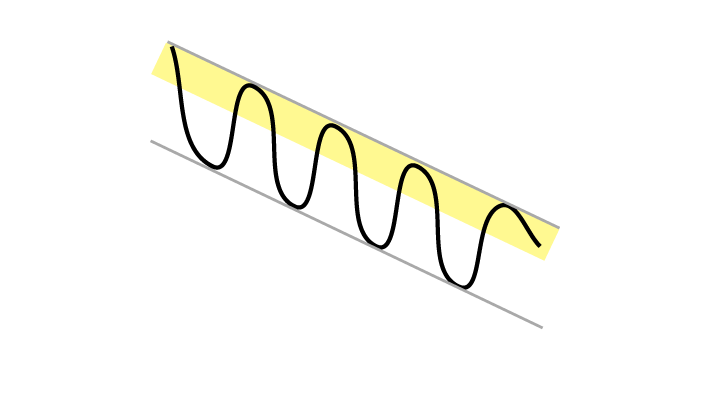 When the price is near the resistance of the trend channel ceiling, there is a big downside to the floor of the trend channel. There is opportunity to make good sales, assuming the trend development continues.
At the same time, the risk of a break upward is greater than when the stock is in the bottom half of the trend channel. A break upward is not a buy signal, see the help item Falling trend breaking upwards, but the stock is assessed as less negative than when the price stays within the trend.
Consequently it is not obviously better to sell a stock near the ceiling of a trend channel than it is to sell when it is in the middle or near the floor.
In Investtech’s analyses, stocks in falling trends are equally negative, regardless of whether the price is near the floor, ceiling or in the middle of the trend channel. A stock is classified as “near trend ceiling” if it is in the upper fifth of the trend channel.
Falling trend breaking upwards
Falling trends indicate that the company experiences negative development and decreasing buy interest among investors. Falling trends indicate that the stocks will continue to fall. Trends often last for longer than investors think they will, and thus many buy a stock too soon.
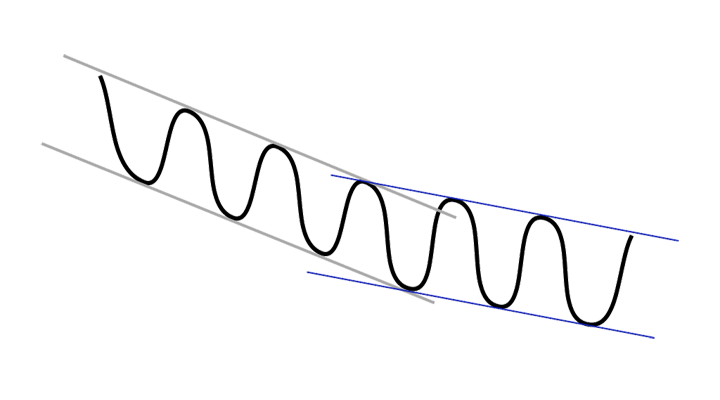 When a falling trend breaks upwards, it signals a change in the rate of decline. Falling trends often begin with a steep rate of decline, but it slows over time. Yet the company can be in a long term negative development and pessimism can reach ever new investor groups and analysts.
The figure shows the normal state of affairs when a falling trend breaks upwards. The original trend in black, the new one in blue.
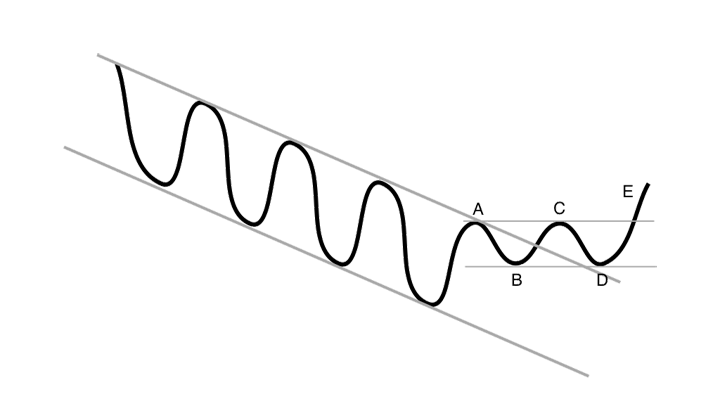 The figure shows the phases of a trend reversal. Warning signals are triggered at the break of the trend ceiling, moving upwards from B to C, while a buy signal is only triggered at point E, when the price ends above that of the previous top.
Volume development matters
If a break upward happens on neutral or declining volume, it is often simply a sign of passive investors. This is natural following a negative news stream, and can be used to sell for those who still own the stock.
If the break upward happens on increasing volume, it indicates that buyers actively have to push the price up to get hold of stocks. This is a sign of a potential change of investor psychology, and can be seen as an early buy signal. A confirmation of the buy signal is only given when the stock price breaks above the previous price chart top.
In Investtech’s analyses, a stock which has broken upwards through a falling trend will be assigned a technical trend score which is half of what a stock in a falling trend will be assigned. It counts as half as negative when a falling trend breaks upwards, as when the stock is in a falling trend or the falling trend breaks downwards.
Investtech Research: Falling trend breaking upwards
Stocks with these myyntisignaalit have on average underperformed compared to benchmark in the following months. Annualised return has been 1.7 percentage points (pp) weaker than benchmark.
| Annualised return (based on 66-day figures) | |
| Myyntisignaalit keskipitkä tähtäin | 8.3% |
| Reference index | 10.0% |
| Excess return | -1.7pp |
The research results are based on 16075 signals from Nordic stocks in the period 2008-2020.
Lue lisää
- Research Report: Investtech-forskning: Brudd ned fra stigende trender og brudd opp fra fallende trender (Vaadittu käyttäjätaso PRO)
- Research Article: Investtech-forskning: Brudd opp fra fallende trend har gitt meravkastning på lang sikt
- Research Report: Investtech-forskning: Trender - signalstatistikk Norden 2019 og 2020 (Vaadittu käyttäjätaso PRO)
- Research Report: Investtech-forskning: Trender - signalstatistikk Norden 2008 - 2020 (Vaadittu käyttäjätaso PRO)
- Research Article: Investtech-forskning: Svak utvikling etter salgssignal fra trend
Price near floor of falling trend
Falling trends indicate that the company experiences negative development and decreasing buy interest among investors. Falling trends signal that the stock price will continue to fall within the trend channel.
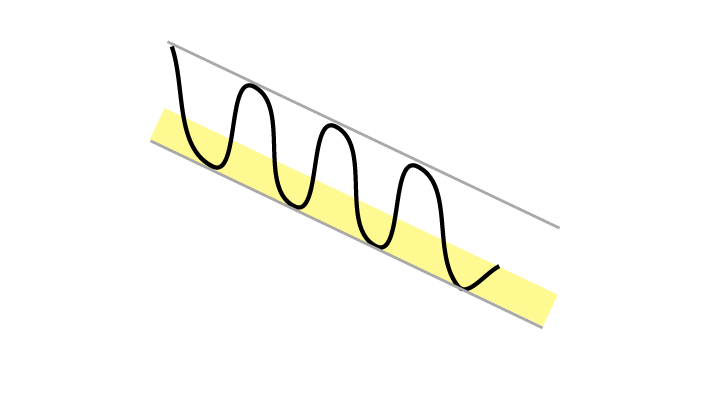 When the price is near the support of the trend channel floor, the upside to the ceiling of the trend channel is quite large. The stock may then see a short term rise.
However, buying near the floor can be a bad strategy, especially in the long term. Two of the most common mistakes investors make are that they hold on to losing stocks for too long and that they are tempted to buy into stocks that are “cheap” after a fall. A stock in a falling trend keeps falling for much longer than many investors think it will. Long term investors would be smart to stay away from stocks in falling trends, even if they are near the floor.
Short term buys near the trend floor can also be a bad strategy. When the price is near the floor, there is a big possibility of a break downward, compared to when the price is in the upper third of the trend channel. A break downward will be a new sell signal and indicate an ever steeper fall in the time ahead. Consequently it will often be a bad idea also for short term investors to keep a stock near the floor of a falling trend channel. This is especially the case for stocks in small and medium sized companies, where there is generally high risk for bigger price fluctuations.
In Investtech’s analyses, stocks in falling trends are equally negative, regardless of whether the price is near the floor, ceiling or in the middle of the trend channel. A stock is classified as “near trend floor” if it is in the lower fifth of the trend channel.
Special circumstances
The upside can be very good when the price is near a trend floor. This makes it tempting to buy stocks in such cases. Buying such stocks can be justified if volume development indicates a coming mood reversal and there are potentially positive fundamental indicators.
However, do mind the very high risk. Price near trend floor in a falling trend gives a high chance of a break downward, but also good potential for a reaction upward. It is considered less risky to buy near trend floor in a falling trend which is almost horizontal than in a trend that is falling sharply.
Falling trend breaking downwards
Falling trends indicate that the company experiences negative development and that buy interest among investors is declining.
Falling trends indicate that the stocks will continue to fall. Trends often last for longer than investors think they will, and thus many buy a stock too soon. If you own a stock in a falling trend, you should normally sell it. If you are looking to buy stocks, you should stay away from stocks that are in falling trends.
 A falling trend breaking downwards signals increasing sales interest among investors. This can be triggered by fundamental aspects in the stock or by media or stock brokers focusing on the company, making more investors aware of the dangers and challenges the company faces.
A break downward is often the beginning of a continued fall, at an even steeper rate.
Special circumstances
In some rare cases, especially if the trend has lasted for a long time and the volume is unusually high, a break downward can signal a sell-off: everything looks negative and every investor wants out. This makes the price fall straight down, while the last investors sell. If the price rises again on high volume, it signals a clear mood change among investors. It is a warning sign of a potential reversal upward.
Nevertheless, the main rule is that a break downward from a falling trend is a negative signal.
In Investtech’s analyses, a stock in a falling trend and a stock that has broken downwards though a falling trend will both be equally negative, given they are otherwise identical.
Investtech Research: Falling trend breaking downwards
Stocks with these myyntisignaalit have on average underperformed compared to benchmark in the following months. Annualised negative excess return has been 9.2 percentage points (pp). This is significantly weaker than benchmark.
| Annualised return (based on 66-day figures) | |
| Myyntisignaalit keskipitkä tähtäin | -0.7% |
| Reference index | 8.5% |
| Excess return | -9.2pp |
The research results are based on 5108 signals from Nordic stocks in the period 2008-2020.
Lue lisää
- Research Article: Investtech Research: Negative excess return after break downwards from falling trend
- Research Report: Investtech-forskning: Trender - signalstatistikk Norden 2019 og 2020 (Vaadittu käyttäjätaso PRO)
- Research Report: Investtech-forskning: Trender - signalstatistikk Norden 2008 - 2020 (Vaadittu käyttäjätaso PRO)
- Research Article: Investtech-forskning: Svak utvikling etter salgssignal fra trend
- Research Report: v2: Investtech-forskning: Trender - signalstatistikk Norden 2008 - 2020 (Vaadittu käyttäjätaso PRO)
Horizontal trend breaking upwards
A break upward through a horizontal trend signals a positive change in investor psychology and is a buy signal.
 Horizontal trends indicate that the investor base is balanced over time. When the price breaks upwards, it signals increased buy interest – there is now a majority of buyers in the stock. This is often a result of fundamental news. Especially if the break upward happens on increasing volume, it signals the start of a rising trend and thereby continued rise in the long term.
A break upward through a horizontal trend is a stronger signal if the price also breaks over the tops that define the trend ceiling. If this is not the case, there will still be resistance at these tops, and the price can more easily fall back again.
Investtech Research: Horizontal trend breaking upwards
Stocks with these ostosignaalit have on average outperformed the market in the following months. Annualised excess return has been 19.1 percentage points (pp). This is significantly better than benchmark.
| Annualised return (based on 66-day figures) | |
| Ostosignaalit keskipitkä tähtäin | 29.4% |
| Reference index | 10.3% |
| Excess return | 19.1pp |
The research results are based on 2540 signals from Nordic stocks in the period 2008-2020.
Lue lisää
- Research Article: Investtech Research: Trend signals remain reliable
- Research Article: Investtech-forskning: Sterk meravkastning etter brudd opp fra horisontal trend
- Research Report: Investtech-forskning: Trender - signalstatistikk Norden 2019 og 2020 (Vaadittu käyttäjätaso PRO)
- Research Report: Investtech-forskning: Trender - signalstatistikk Norden 2008 - 2020 (Vaadittu käyttäjätaso PRO)
Horizontal trend breaking downwards
A break downward through a horizontal trend signals a negative change in investor psychology and is a sell signal.
 Horizontal trends indicate that the investor base is balanced over time. When the price breaks downwards, it signals increased sell interest – there is a majority of sellers in the stock. This may well be a result of fundamental news. Especially if a break downward happens on increasing volume, it signals the start of a falling trend and thus continued fall in the long term.
A break downward through a horizontal trend is a stronger signal if the price also breaks below the bottom points that define the trend floor. Otherwise there will still be support at these points, which means the price can more easily rise back up again.
Investtech Research: Horizontal trend breaking downwards
Stocks with these myyntisignaalit have on average underperformed compared to benchmark in the following months. Annualised negative excess return has been 7.3 percentage points (pp). This is significantly weaker than benchmark.
| Annualised return (based on 66-day figures) | |
| Myyntisignaalit keskipitkä tähtäin | 14.4% |
| Reference index | 21.7% |
| Excess return | -7.3pp |
The research results are based on 2222 signals from Nordic stocks in the period 2008-2020.
Lue lisää
- Research Article: Investtech-forskning: Brudd ned fra horisontal trend er et salgssignal
- Research Report: Investtech-forskning: Trender - signalstatistikk Norden 2019 og 2020 (Vaadittu käyttäjätaso PRO)
- Research Report: Investtech-forskning: Trender - signalstatistikk Norden 2008 - 2020 (Vaadittu käyttäjätaso PRO)
- Research Article: Investtech-forskning: Svak utvikling etter salgssignal fra trend
Investtech ei takaa analyysien tarkkuutta tai kattavuutta. Kaikkien analyysien tuottamien neuvojen ja signaalien käyttäminen on täysin käyttäjän vastuulla. Investtech ei vastaa mistään tappioista, jotka saattavat syntyä Investtechin analyysien käytön seurauksena. Mahdollisten eturistiriitojen yksityiskohdat mainitaan aina sijoitusneuvon yhteydessä. Lisätietoja Investtechin analyyseistä löytyy täältä disclaimer.
Investtech ei takaa analyysien tarkkuutta tai kattavuutta. Kaikkien analyysien tuottamien neuvojen ja signaalien käyttäminen on täysin käyttäjän vastuulla. Investtech ei vastaa mistään tappioista, jotka saattavat syntyä Investtechin analyysien käytön seurauksena. Mahdollisten eturistiriitojen yksityiskohdat mainitaan aina sijoitusneuvon yhteydessä. Lisätietoja Investtechin analyyseistä löytyy täältä disclaimer.


 Oslo Børs
 Stockholmsbörsen
 Københavns Fondsbørs
 Helsingin pörssi
 World Indices
 US Stocks
 Toronto Stock Exchange
 London Stock Exchange
 Euronext Amsterdam
 Euronext Brussel
 DAX
DAX CAC 40
 Mumbai S.E.
 Commodities
 Currency
 Cryptocurrency
 Exchange Traded Funds
 Investtech Indices